Who Owns Hemogenyx Pharmaceuticals Plc (LON:HEMO)?

Today, I will be analyzing Hemogenyx Pharmaceuticals Plc’s (LSE:HEMO) recent ownership structure, an important but not-so-popular subject among individual investors. Ownership structure of a company has been found to affect share performance over time. Differences in ownership structure of companies can have a profound effect on how management’s incentives are aligned with shareholder returns, which is why we’ll take a moment to analyse HEMO’s shareholder registry. All data provided is as of the most recent financial year end.
View our latest analysis for Hemogenyx Pharmaceuticals
Institutional Ownership
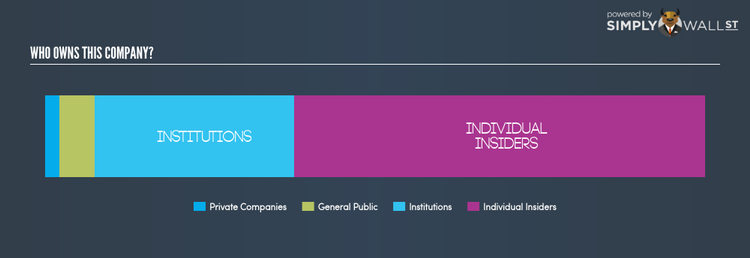
Institutions account for 30.19% of HEMO’s outstanding shares, a significant enough holding to move stock prices if they start buying and selling in large quantities, especially when there are relatively small amounts of shares available on the market to trade. However, as not all institutions are alike, such high volatility events, especially in the short-term, have been more frequently linked to active market participants like hedge funds. In the case of HEMO, investors need not worry about such volatility considering active hedge funds don’t have a significant stake. However, we should dig deeper into HEMO’s ownership structure and find out how other key ownership classes can affect its investment profile.
Insider Ownership
Insiders form another group of important ownership types as they manage the company’s operations and decide the best use of capital. Insider ownership has been linked to better alignment between management and shareholders. 62.19% ownership of HEMO insiders is large enough to make an impact on shareholder returns. In general, this level of insider ownership has negatively affected underperforming (consistently low PE ratio) companies and positively affected the companies that outperform (consistently high PE ratio). It’s also interesting to learn what HEMO insiders have been doing with their shareholdings lately. While insider buying is possibly a sign of a positive outlook for the company, selling doesn’t necessarily indicate a negative outlook as they may be selling to meet personal financial needs.
General Public Ownership
The general public holds 5.33% stake in HEMO, thus, representing an important class of owners. While this size of ownership may not be enough to sway a policy decision in their favour, they can still make a collective impact on company policies if it aligns with other large shareholders.
Private Company Ownership
Another important group of owners for potential investors in HEMO are private companies that hold a stake of 2.29% in HEMO. These are companies that are mainly invested due to their strategic interests or are incentivized by reaping capital gains on investments their shareholdings. However, an ownership of this size may be relatively insignificant, meaning that these shareholders may not have the potential to influence HEMO’s business strategy. Thus, investors not need worry too much about the consequences of these holdings.
What this means for you:
HEMO’s considerably high level of institutional ownership calls for further analysis into its margin of safety. This will enable shareholders to comfortably invest in the company while avoid getting trapped in a sustained sell-off that is often observed in stocks with this level of institutional participation. However, ownership structure should not be the only determining factor when you’re building an investment thesis for HEMO. Rather, you should be examining fundamental factors such as Hemogenyx Pharmaceuticals’s past track record and financial health. I highly recommend you to complete your research by taking a look at the following:
1. Financial Health: Is HEMO’s operations financially sustainable? Balance sheets can be hard to analyze, which is why we’ve done it for you. Check out our financial health checks here.
2. Other High-Performing Stocks: Are there other stocks that provide better prospects with proven track records? Explore our free list of these great stocks here.
NB: Figures in this article are calculated using data from the last twelve months, which refer to the 12-month period ending on the last date of the month the financial statement is dated. This may not be consistent with full year annual report figures.
To help readers see pass the short term volatility of the financial market, we aim to bring you a long-term focused research analysis purely driven by fundamental data. Note that our analysis does not factor in the latest price sensitive company announcements.
The author is an independent contributor and at the time of publication had no position in the stocks mentioned.
