Oxford Industries, Inc. (NYSE:OXM) Stock Has Shown Weakness Lately But Financials Look Strong: Should Prospective Shareholders Make The Leap?
Oxford Industries (NYSE:OXM) has had a rough month with its share price down 7.3%. However, a closer look at its sound financials might cause you to think again. Given that fundamentals usually drive long-term market outcomes, the company is worth looking at. Specifically, we decided to study Oxford Industries' ROE in this article.
Return on equity or ROE is a key measure used to assess how efficiently a company's management is utilizing the company's capital. Put another way, it reveals the company's success at turning shareholder investments into profits.
See our latest analysis for Oxford Industries
How Is ROE Calculated?
The formula for return on equity is:
Return on Equity = Net Profit (from continuing operations) ÷ Shareholders' Equity
So, based on the above formula, the ROE for Oxford Industries is:
27% = US$167m ÷ US$607m (Based on the trailing twelve months to April 2023).
The 'return' is the amount earned after tax over the last twelve months. One way to conceptualize this is that for each $1 of shareholders' capital it has, the company made $0.27 in profit.
What Is The Relationship Between ROE And Earnings Growth?
We have already established that ROE serves as an efficient profit-generating gauge for a company's future earnings. Based on how much of its profits the company chooses to reinvest or "retain", we are then able to evaluate a company's future ability to generate profits. Assuming all else is equal, companies that have both a higher return on equity and higher profit retention are usually the ones that have a higher growth rate when compared to companies that don't have the same features.
Oxford Industries' Earnings Growth And 27% ROE
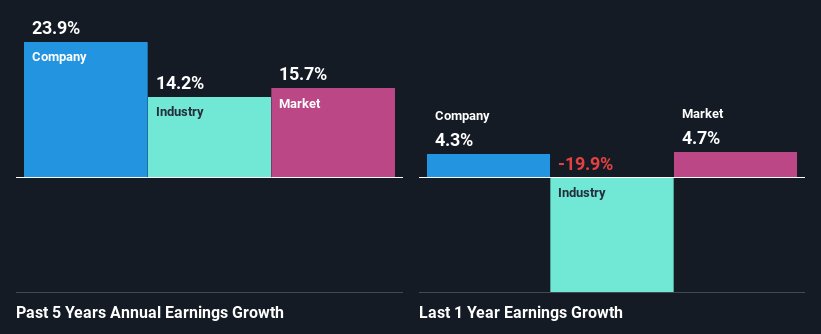
First thing first, we like that Oxford Industries has an impressive ROE. Additionally, the company's ROE is higher compared to the industry average of 16% which is quite remarkable. As a result, Oxford Industries' exceptional 24% net income growth seen over the past five years, doesn't come as a surprise.
As a next step, we compared Oxford Industries' net income growth with the industry, and pleasingly, we found that the growth seen by the company is higher than the average industry growth of 14%.
The basis for attaching value to a company is, to a great extent, tied to its earnings growth. It’s important for an investor to know whether the market has priced in the company's expected earnings growth (or decline). This then helps them determine if the stock is placed for a bright or bleak future. Is Oxford Industries fairly valued compared to other companies? These 3 valuation measures might help you decide.
Is Oxford Industries Making Efficient Use Of Its Profits?
Oxford Industries has a really low three-year median payout ratio of 19%, meaning that it has the remaining 81% left over to reinvest into its business. So it looks like Oxford Industries is reinvesting profits heavily to grow its business, which shows in its earnings growth.
Moreover, Oxford Industries is determined to keep sharing its profits with shareholders which we infer from its long history of paying a dividend for at least ten years. Upon studying the latest analysts' consensus data, we found that the company's future payout ratio is expected to rise to 24% over the next three years. Despite the higher expected payout ratio, the company's ROE is not expected to change by much.
Summary
On the whole, we feel that Oxford Industries' performance has been quite good. Specifically, we like that the company is reinvesting a huge chunk of its profits at a high rate of return. This of course has caused the company to see substantial growth in its earnings. That being so, a study of the latest analyst forecasts show that the company is expected to see a slowdown in its future earnings growth. To know more about the company's future earnings growth forecasts take a look at this free report on analyst forecasts for the company to find out more.
Have feedback on this article? Concerned about the content? Get in touch with us directly. Alternatively, email editorial-team (at) simplywallst.com.
This article by Simply Wall St is general in nature. We provide commentary based on historical data and analyst forecasts only using an unbiased methodology and our articles are not intended to be financial advice. It does not constitute a recommendation to buy or sell any stock, and does not take account of your objectives, or your financial situation. We aim to bring you long-term focused analysis driven by fundamental data. Note that our analysis may not factor in the latest price-sensitive company announcements or qualitative material. Simply Wall St has no position in any stocks mentioned.
Join A Paid User Research Session
You’ll receive a US$30 Amazon Gift card for 1 hour of your time while helping us build better investing tools for the individual investors like yourself. Sign up here
