Oxford Metrics plc's (LON:OMG) Financials Are Too Obscure To Link With Current Share Price Momentum: What's In Store For the Stock?
Most readers would already be aware that Oxford Metrics' (LON:OMG) stock increased significantly by 35% over the past three months. However, we wonder if the company's inconsistent financials would have any adverse impact on the current share price momentum. Particularly, we will be paying attention to Oxford Metrics' ROE today.
Return on equity or ROE is a key measure used to assess how efficiently a company's management is utilizing the company's capital. In other words, it is a profitability ratio which measures the rate of return on the capital provided by the company's shareholders.
View our latest analysis for Oxford Metrics
How Do You Calculate Return On Equity?
The formula for return on equity is:
Return on Equity = Net Profit (from continuing operations) ÷ Shareholders' Equity
So, based on the above formula, the ROE for Oxford Metrics is:
7.0% = UK£5.7m ÷ UK£81m (Based on the trailing twelve months to September 2023).
The 'return' is the income the business earned over the last year. That means that for every £1 worth of shareholders' equity, the company generated £0.07 in profit.
Why Is ROE Important For Earnings Growth?
We have already established that ROE serves as an efficient profit-generating gauge for a company's future earnings. We now need to evaluate how much profit the company reinvests or "retains" for future growth which then gives us an idea about the growth potential of the company. Assuming all else is equal, companies that have both a higher return on equity and higher profit retention are usually the ones that have a higher growth rate when compared to companies that don't have the same features.
A Side By Side comparison of Oxford Metrics' Earnings Growth And 7.0% ROE
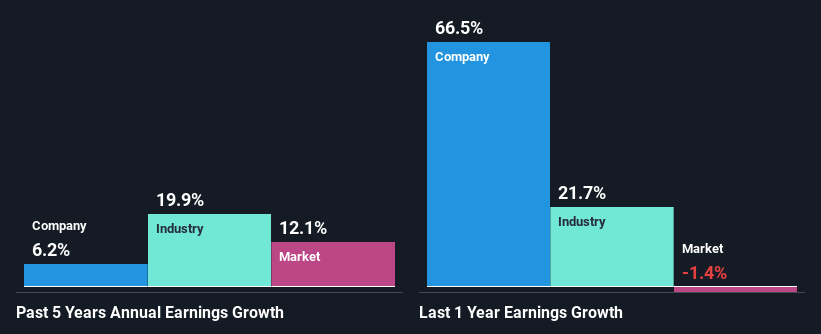
On the face of it, Oxford Metrics' ROE is not much to talk about. Yet, a closer study shows that the company's ROE is similar to the industry average of 8.5%. Having said that, Oxford Metrics has shown a modest net income growth of 6.2% over the past five years. Considering the moderately low ROE, it is quite possible that there might be some other aspects that are positively influencing the company's earnings growth. Such as - high earnings retention or an efficient management in place.
We then compared Oxford Metrics' net income growth with the industry and found that the company's growth figure is lower than the average industry growth rate of 20% in the same 5-year period, which is a bit concerning.
The basis for attaching value to a company is, to a great extent, tied to its earnings growth. It’s important for an investor to know whether the market has priced in the company's expected earnings growth (or decline). Doing so will help them establish if the stock's future looks promising or ominous. Is OMG fairly valued? This infographic on the company's intrinsic value has everything you need to know.
Is Oxford Metrics Efficiently Re-investing Its Profits?
While Oxford Metrics has a three-year median payout ratio of 83% (which means it retains 17% of profits), the company has still seen a fair bit of earnings growth in the past, meaning that its high payout ratio hasn't hampered its ability to grow.
Additionally, Oxford Metrics has paid dividends over a period of at least ten years which means that the company is pretty serious about sharing its profits with shareholders. Upon studying the latest analysts' consensus data, we found that the company's future payout ratio is expected to drop to 59% over the next three years. However, the company's ROE is not expected to change by much despite the lower expected payout ratio.
Conclusion
In total, we're a bit ambivalent about Oxford Metrics' performance. While the company has posted a decent earnings growth, We do feel that the earnings growth number could have been even higher, had the company been reinvesting more of its earnings at a higher rate of return. Until now, we have only just grazed the surface of the company's past performance by looking at the company's fundamentals. To gain further insights into Oxford Metrics' past profit growth, check out this visualization of past earnings, revenue and cash flows.
Have feedback on this article? Concerned about the content? Get in touch with us directly. Alternatively, email editorial-team (at) simplywallst.com.
This article by Simply Wall St is general in nature. We provide commentary based on historical data and analyst forecasts only using an unbiased methodology and our articles are not intended to be financial advice. It does not constitute a recommendation to buy or sell any stock, and does not take account of your objectives, or your financial situation. We aim to bring you long-term focused analysis driven by fundamental data. Note that our analysis may not factor in the latest price-sensitive company announcements or qualitative material. Simply Wall St has no position in any stocks mentioned.
