Can S.P. Apparels Limited (NSE:SPAL) Maintain Its Strong Returns?

Want to participate in a research study? Help shape the future of investing tools and earn a $60 gift card!
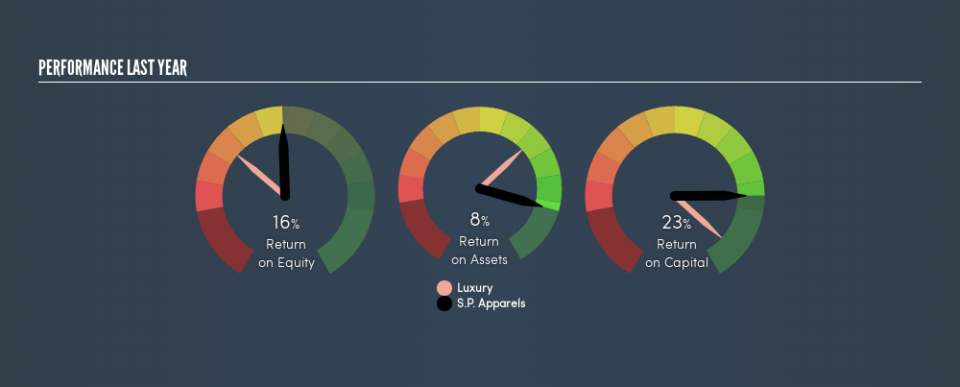
Many investors are still learning about the various metrics that can be useful when analysing a stock. This article is for those who would like to learn about Return On Equity (ROE). We'll use ROE to examine S.P. Apparels Limited (NSE:SPAL), by way of a worked example.
Over the last twelve months S.P. Apparels has recorded a ROE of 16%. That means that for every ₹1 worth of shareholders' equity, it generated ₹0.16 in profit.
View our latest analysis for S.P. Apparels
How Do You Calculate Return On Equity?
The formula for ROE is:
Return on Equity = Net Profit ÷ Shareholders' Equity
Or for S.P. Apparels:
16% = ₹675m ÷ ₹4.3b (Based on the trailing twelve months to December 2018.)
Most know that net profit is the total earnings after all expenses, but the concept of shareholders' equity is a little more complicated. It is all the money paid into the company from shareholders, plus any earnings retained. The easiest way to calculate shareholders' equity is to subtract the company's total liabilities from the total assets.
What Does ROE Signify?
Return on Equity measures a company's profitability against the profit it has kept for the business (plus any capital injections). The 'return' is the profit over the last twelve months. The higher the ROE, the more profit the company is making. So, all else equal, investors should like a high ROE. That means it can be interesting to compare the ROE of different companies.
Does S.P. Apparels Have A Good Return On Equity?
Arguably the easiest way to assess company's ROE is to compare it with the average in its industry. However, this method is only useful as a rough check, because companies do differ quite a bit within the same industry classification. Pleasingly, S.P. Apparels has a superior ROE than the average (8.1%) company in the Luxury industry.
That's what I like to see. We think a high ROE, alone, is usually enough to justify further research into a company. For example you might check if insiders are buying shares.
Why You Should Consider Debt When Looking At ROE
Most companies need money -- from somewhere -- to grow their profits. That cash can come from retained earnings, issuing new shares (equity), or debt. In the case of the first and second options, the ROE will reflect this use of cash, for growth. In the latter case, the use of debt will improve the returns, but will not change the equity. In this manner the use of debt will boost ROE, even though the core economics of the business stay the same.
Combining S.P. Apparels's Debt And Its 16% Return On Equity
Although S.P. Apparels does use debt, its debt to equity ratio of 0.43 is still low. Its very respectable ROE, combined with only modest debt, suggests the business is in good shape. Conservative use of debt to boost returns is usually a good move for shareholders, though it does leave the company more exposed to interest rate rises.
The Key Takeaway
Return on equity is useful for comparing the quality of different businesses. In my book the highest quality companies have high return on equity, despite low debt. If two companies have around the same level of debt to equity, and one has a higher ROE, I'd generally prefer the one with higher ROE.
But ROE is just one piece of a bigger puzzle, since high quality businesses often trade on high multiples of earnings. It is important to consider other factors, such as future profit growth -- and how much investment is required going forward. So you might want to check this FREE visualization of analyst forecasts for the company.
If you would prefer check out another company -- one with potentially superior financials -- then do not miss this free list of interesting companies, that have HIGH return on equity and low debt.
We aim to bring you long-term focused research analysis driven by fundamental data. Note that our analysis may not factor in the latest price-sensitive company announcements or qualitative material.
If you spot an error that warrants correction, please contact the editor at editorial-team@simplywallst.com. This article by Simply Wall St is general in nature. It does not constitute a recommendation to buy or sell any stock, and does not take account of your objectives, or your financial situation. Simply Wall St has no position in the stocks mentioned. Thank you for reading.
