Here’s How P/E Ratios Can Help Us Understand Lai Sun Development Company Limited (HKG:488)

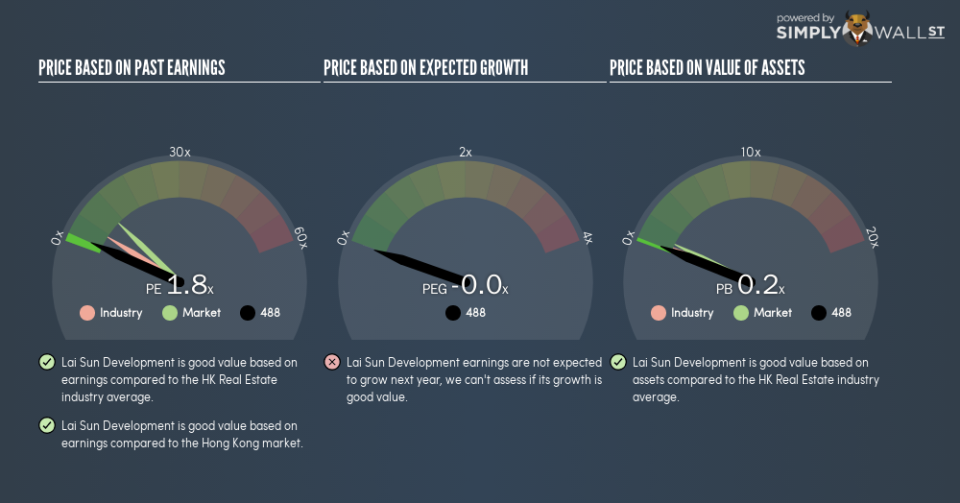
This article is written for those who want to get better at using price to earnings ratios (P/E ratios). We’ll show how you can use Lai Sun Development Company Limited’s (HKG:488) P/E ratio to inform your assessment of the investment opportunity. Lai Sun Development has a price to earnings ratio of 1.77, based on the last twelve months. That corresponds to an earnings yield of approximately 57%.
View our latest analysis for Lai Sun Development
How Do I Calculate A Price To Earnings Ratio?
The formula for price to earnings is:
Price to Earnings Ratio = Share Price ÷ Earnings per Share (EPS)
Or for Lai Sun Development:
P/E of 1.77 = HK$12.64 ÷ HK$7.16 (Based on the trailing twelve months to July 2018.)
Is A High P/E Ratio Good?
A higher P/E ratio implies that investors pay a higher price for the earning power of the business. All else being equal, it’s better to pay a low price — but as Warren Buffett said, ‘It’s far better to buy a wonderful company at a fair price than a fair company at a wonderful price.’
How Growth Rates Impact P/E Ratios
Earnings growth rates have a big influence on P/E ratios. When earnings grow, the ‘E’ increases, over time. That means even if the current P/E is high, it will reduce over time if the share price stays flat. So while a stock may look expensive based on past earnings, it could be cheap based on future earnings.
Notably, Lai Sun Development grew EPS by a whopping 107% in the last year. And it has improved its earnings per share by 8.6% per year over the last three years. So we’d generally expect it to have a relatively high P/E ratio. But earnings per share are down 1.0% per year over the last five years.
How Does Lai Sun Development’s P/E Ratio Compare To Its Peers?
We can get an indication of market expectations by looking at the P/E ratio. If you look at the image below, you can see Lai Sun Development has a lower P/E than the average (5.2) in the real estate industry classification.
Lai Sun Development’s P/E tells us that market participants think it will not fare as well as its peers in the same industry. While current expectations are low, the stock could be undervalued if the situation is better than the market assumes. If you consider the stock interesting, further research is recommended. For example, I often monitor director buying and selling.
Don’t Forget: The P/E Does Not Account For Debt or Bank Deposits
Don’t forget that the P/E ratio considers market capitalization. In other words, it does not consider any debt or cash that the company may have on the balance sheet. In theory, a company can lower its future P/E ratio by using cash or debt to invest in growth.
Such expenditure might be good or bad, in the long term, but the point here is that the balance sheet is not reflected by this ratio.
Lai Sun Development’s Balance Sheet
Lai Sun Development has net debt worth a very significant 105% of its market capitalization. This is a relatively high level of debt, so the stock probably deserves a relatively low P/E ratio. Keep that in mind when comparing it to other companies.
The Verdict On Lai Sun Development’s P/E Ratio
Lai Sun Development trades on a P/E ratio of 1.8, which is below the HK market average of 10.3. The company has a meaningful amount of debt on the balance sheet, but that should not eclipse the solid earnings growth. If it continues to grow, then the current low P/E may prove to be unjustified.
When the market is wrong about a stock, it gives savvy investors an opportunity. As value investor Benjamin Graham famously said, ‘In the short run, the market is a voting machine but in the long run, it is a weighing machine.’ So this free visual report on analyst forecasts could hold they key to an excellent investment decision.
But note: Lai Sun Development may not be the best stock to buy. So take a peek at this free list of interesting companies with strong recent earnings growth (and a P/E ratio below 20).
To help readers see past the short term volatility of the financial market, we aim to bring you a long-term focused research analysis purely driven by fundamental data. Note that our analysis does not factor in the latest price-sensitive company announcements.
The author is an independent contributor and at the time of publication had no position in the stocks mentioned. For errors that warrant correction please contact the editor at editorial-team@simplywallst.com.
