Is Pacific Biosciences of California (PACB) Too Good to Be True? A Comprehensive Analysis of a ...
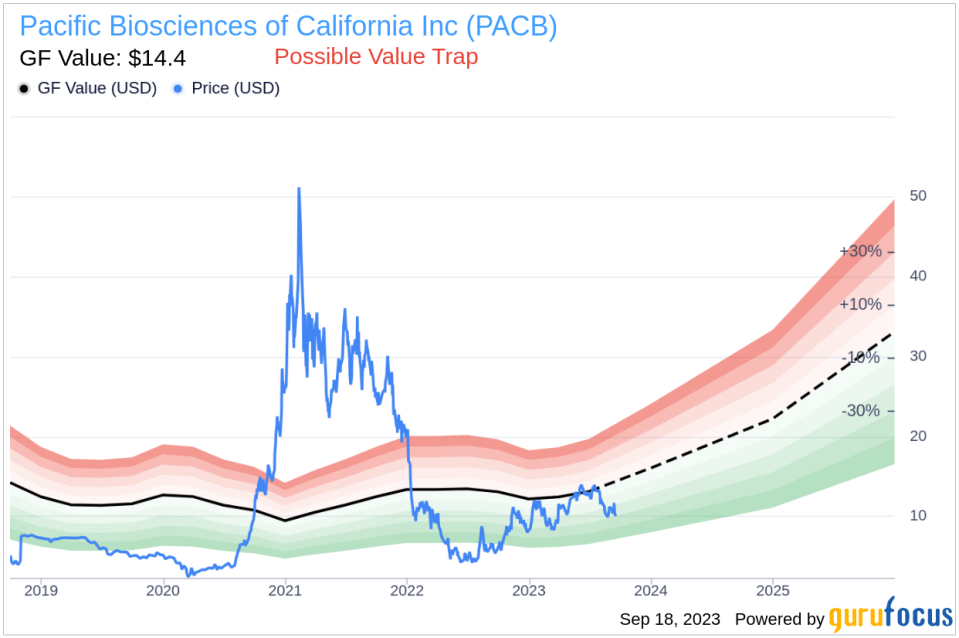
Value-focused investors are always on the hunt for stocks that are priced below their intrinsic value. One such stock that merits attention is Pacific Biosciences of California Inc (NASDAQ:PACB). The stock, which is currently priced at 10.06, recorded a loss of 3.5% in a day and a 3-month decrease of 20.47%. The stock's fair valuation is $14.4, as indicated by its GF Value.
Understanding GF Value
The GF Value represents the current intrinsic value of a stock derived from our exclusive method. The GF Value Line on our summary page gives an overview of the fair value that the stock should be traded at. It is calculated based on three factors: historical multiples (PE Ratio, PS Ratio, PB Ratio and Price-to-Free-Cash-Flow) that the stock has traded at, GuruFocus adjustment factor based on the company's past returns and growth, and future estimates of the business performance.
We believe the GF Value Line is the fair value that the stock should be traded at. The stock price will most likely fluctuate around the GF Value Line. If the stock price is significantly above the GF Value Line, it is overvalued and its future return is likely to be poor. On the other hand, if it is significantly below the GF Value Line, its future return will likely be higher.
However, investors need to consider a more in-depth analysis before making an investment decision. Despite its seemingly attractive valuation, certain risk factors associated with Pacific Biosciences of California Inc (NASDAQ:PACB) should not be ignored. These risks are primarily reflected through its low Piotroski F-score of 2, Altman Z-score of 0.06, and the company's revenues and earnings have been on a downward trend over the past five years, which raises a crucial question: Is Pacific Biosciences of California a hidden gem or a value trap?
These indicators suggest that Pacific Biosciences of California, despite its apparent undervaluation, might be a potential value trap. This complexity underlines the importance of thorough due diligence in investment decision-making.
Deciphering the Piotroski F-score and Altman Z-score
The Piotroski F-score, created by accounting professor Joseph Piotroski, is a tool used to assess the strength of a company's financial health. The score is based on nine criteria that fall into three categories: profitability, leverage/liquidity/ source of funds, and operating efficiency. The overall score ranges from 0 to 9, with higher scores indicating healthier financials. Pacific Biosciences of California's current Piotroski F-Score, however, falls in the lower end of this spectrum, indicating potential red flags for investors.
Before delving into the details, let's understand what the Altman Z-score entails. Invented by New York University Professor Edward I. Altman in 1968, the Z-Score is a financial model that predicts the probability of a company entering bankruptcy within a two-year time frame. The Altman Z-Score combines five different financial ratios, each weighted to create a final score. A score below 1.8 suggests a high likelihood of financial distress, while a score above 3 indicates a low risk.
Company Overview: Pacific Biosciences of California
Pacific Biosciences of California Inc is a biotechnology company focused on the design, development, and commercialization of tools for biological research. The company develops sequencing systems to assist in resolving genetically complex problems. Its sequencing systems provide access to a wide range of applications and are designed for expandable improvements to performance capability. The majority of the company's revenue is derived from North America, followed by Asia and Europe.
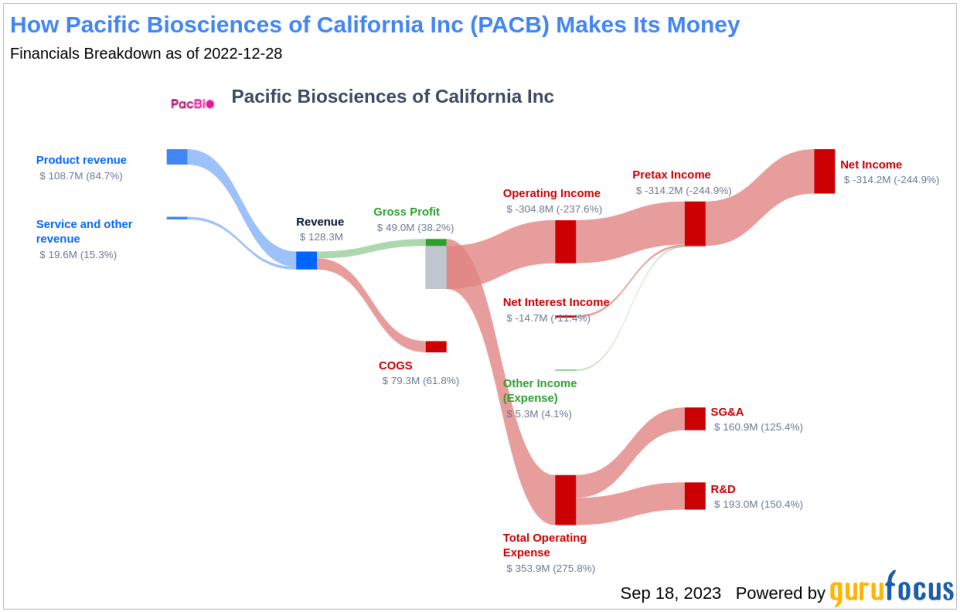
Analysis of Pacific Biosciences of California's Profitability
Firstly, let's address profitability. One significant component of the F-Score is a positive return on assets (ROA). A closer look at Pacific Biosciences of California's ROA reveals a worrying trend of negative returns. This indicates the company's inability to generate profit from its assets - a fundamental concern for any investor.
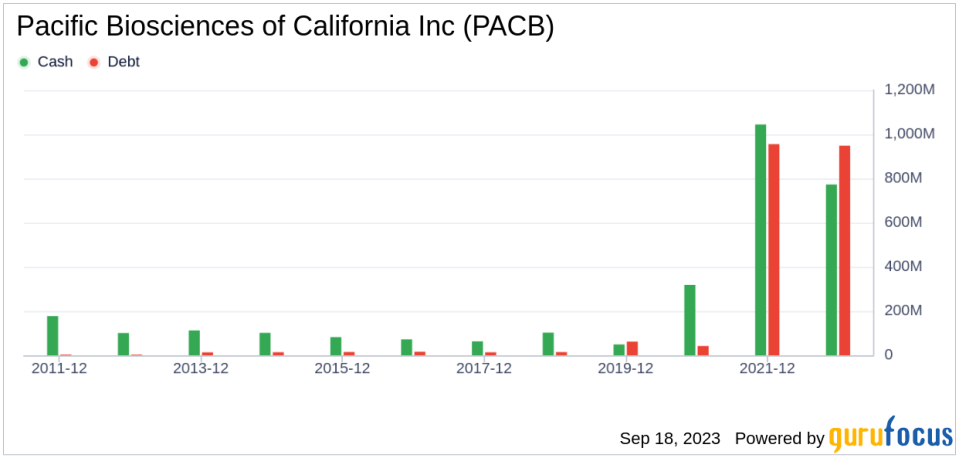
Observing the financials of Pacific Biosciences of California, it's important to note that the cash flow from operations over the trailing twelve months (TTM) stands at $-260.05 million, whereas the net income in the same period is significantly higher at $-319.2 million. The Piotroski F-score considers this discrepancy as a potential red flag. The rationale behind this is that a company's operating cash flow is a more direct and less manipulated measure of its cash-generating ability than net income. Net income, while important, is susceptible to accounting treatments and non-cash items which can distort the true cash profitability of the company. If a company consistently shows lower cash flows from operations relative to its net income, it could indicate that the earnings quality is poor and the company might have difficulties sustaining its operations or financing its obligations, a fact which could negatively impact its financial stability and investor confidence.
Leverage, Liquidity and Source of Funds: A Worrying Trend
Assessing the aspect of leverage, liquidity, and sources of funds, Pacific Biosciences of California demonstrates an alarming rise in its debt-to-total assets ratio over the past three years. The provided data shows 2021: 0.75; 2022: 0.51; 2023: 0.51, expressed as percentages. A higher debt ratio suggests that Pacific Biosciences of California is increasingly financing its assets through debt, thereby escalating its financial risk. The Piotroski F-Score views this as a negative indicator, further cautioning investors about Pacific Biosciences of California.
Operating Efficiency: A Darker Picture
Examining the data provided: 2021: 198.57; 2022: 224.50; 2023: 250.07, it becomes evident that Pacific Biosciences of California has seen an increase in its Diluted Average Shares Outstanding over the past three years. This trend signals that the company has issued more shares. While issuing additional shares can provide immediate capital for the business, it can also lead to the dilution of existing shares' value. This dilution occurs because the earnings of the company now have to be divided among a larger pool of shares, which could decrease Earnings Per Share (EPS). Consequently, if the company's earnings don't grow at a pace that matches or exceeds this share increase, it could lead to a reduction in the value perceived by existing shareholders, potentially impacting their investment returns. Hence, while additional share issuance may provide necessary capital, it is important to monitor its impact on shareholder value carefully.
Lastly, concerning operating efficiency, the Piotroski F-score examines changes in gross margin and asset turnover. Regrettably, Pacific Biosciences of California follows a discouraging trajectory with a decrease in gross margin percentage over the past three years, as demonstrated by the data provided: 2021: 42.71; 2022: 44.77; 2023: 30.10 (expressed in percentages). This contraction in gross margin suggests that Pacific Biosciences of California is grappling with either an escalation in the cost of goods sold or dwindling prices - both of which are inauspicious indicators for profitability.
In terms of operational efficiency, another key indicator, Pacific Biosciences of California has unfortunately reported a declining trend in asset turnover over the past three years, as evidenced by the data: 2021: 0.15; 2022: 0.08; 2023: 0.08 (expressed in percentages). Asset turnover measures how effectively a company uses its assets to generate sales, and a decrease in this ratio can indicate a drop in efficiency. This could be due to various factors, such as underutilization of assets or a decline in the market demand for the company's products or services. Consequently, this downward trend in asset turnover implies that Pacific Biosciences of California may need to revisit its operational strategies to improve the utilization of its assets and boost its sales volume.
While the Piotroski F-score is not the only lens through which to view a potential investment, it is a robust and comprehensive tool for evaluating a company's financial health. Unfortunately for Pacific Biosciences of California, its current score suggests potential troubles.
A dissection of Pacific Biosciences of California's Altman Z-score reveals Pacific Biosciences of California's financial health may be weak, suggesting possible financial distress:
The EBIT to Total Assets ratio serves as a crucial barometer of a company's operational effectiveness, correlating earnings before interest and taxes (EBIT) to total assets. An analysis of Pacific Biosciences of California's EBIT to Total Assets ratio from historical data (2021: -0.06; 2022: -0.15; 2023: -0.17) indicates a recent dip following an initial rise. This reduction suggests that Pacific Biosciences of California might not be utilizing its assets to their full potential to generate operational profits, which could be negatively affecting the company's overall Z-score.
When it comes to operational efficiency, a vital indicator for Pacific Biosciences of California is its asset turnover. The data: 2021: 0.15; 2022: 0.08; 2023: 0.08 from the past three years suggests a decreasing trend in this ratio. The asset turnover ratio reflects how effectively a company is using its assets to generate sales. Therefore, a drop in this ratio can signify reduced operational efficiency, potentially due to underutilization of assets or decreased market demand for the company's products or services. This shift in Pacific Biosciences of California's asset turnover underlines the need for the company to reassess its operational strategies to optimize asset usage and boost sales.
One of the telltale indicators of a company's potential trouble is a sustained decline in revenues. In the case of Pacific Biosciences of California, both the
This article first appeared on GuruFocus.
