Papa John's (NASDAQ:PZZA) Misses Q3 Revenue Estimates

Fast-food pizza chain Papa John’s (NASDAQ:PZZA) missed analysts' expectations in Q3 FY2023, with revenue up 2.41% year on year to $522.8 million. Turning to EPS, Papa John's made a non-GAAP profit of $0.53 per share, down from its profit of $0.54 per share in the same quarter last year.
Is now the time to buy Papa John's? Find out by accessing our full research report, it's free.
Papa John's (PZZA) Q3 FY2023 Highlights:
Revenue: $522.8 million vs analyst estimates of $530.3 million (1.42% miss)
EPS (non-GAAP): $0.53 vs analyst expectations of $0.57 (6.49% miss)
Free Cash Flow of $17.1 million, down 53.4% from the previous quarter
Gross Margin (GAAP): 30.2%, up from 29.6% in the same quarter last year
Same-Store Sales were up 2.2% year on year (beat vs. expectations)
Store Locations: 5,825 at quarter end, increasing by 236 over the last 12 months
“Strong execution by our teams and franchisees led to solid system-wide restaurant sales growth, transaction-led North America comp growth and improving North America restaurant-level margin in the third quarter,” said Rob Lynch, Papa Johns president and CEO.
Founded by the eclectic John “Papa John” Schnatter, Papa John’s (NASDAQ:PZZA) is a globally recognized pizza delivery and carryout chain known for “better ingredients” and “better pizza”.
Traditional Fast Food
Traditional fast-food restaurants are renowned for their speed and convenience, boasting menus filled with familiar and budget-friendly items. Their reputations for on-the-go consumption make them favored destinations for individuals and families needing a quick meal. This class of restaurants, however, is fighting the perception that their meals are unhealthy and made with inferior ingredients, a battle that's especially relevant today given the consumers increasing focus on health and wellness.
Sales Growth
Papa John's is larger than most restaurant chains and benefits from economies of scale, giving it an edge over its smaller competitors.
As you can see below, the company's annualized revenue growth rate of 6.93% over the last four years (we compare to 2019 to normalize for COVID-19 impacts) was mediocre, but to its credit, it opened new restaurants and grew sales at existing, established dining locations.
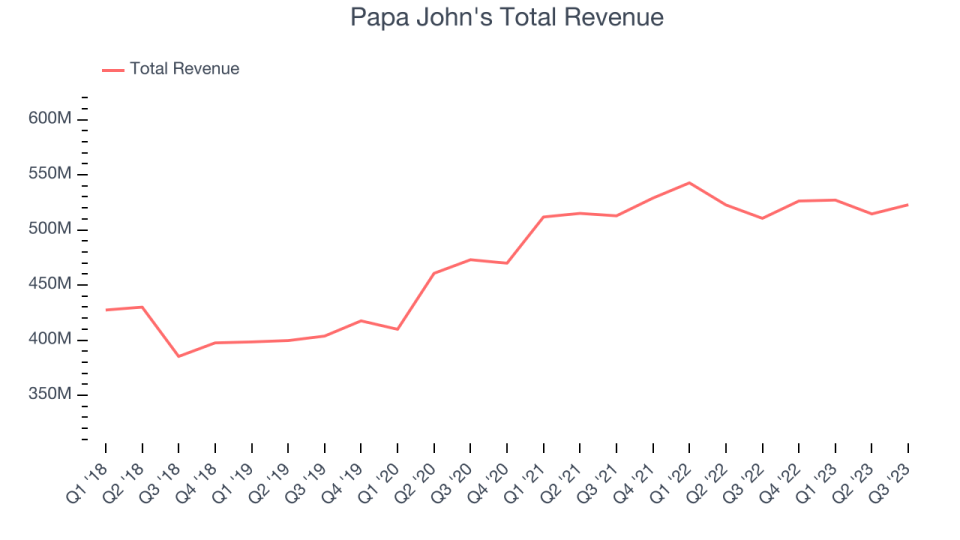
This quarter, Papa John's revenue grew 2.41% year on year to $522.8 million, falling short of Wall Street's estimates. Looking ahead, the analysts covering the company expect sales to grow 7.98% over the next 12 months.
The pandemic fundamentally changed several consumer habits. There is a founder-led company that is massively benefiting from this shift. The business has grown astonishingly fast, with 40%+ free cash flow margins. Its fundamentals are undoubtedly best-in-class. Still, the total addressable market is so big that the company has room to grow many times in size. You can find it on our platform for free.
Number of Stores
When a chain like Papa John's is opening new restaurants, it usually means it's investing for growth because there's healthy demand for its meals and there are markets where the concept has few or no locations. Since last year, Papa John's restaurant count increased by 236, or 4.22%, to 5,825 locations in the most recently reported quarter.
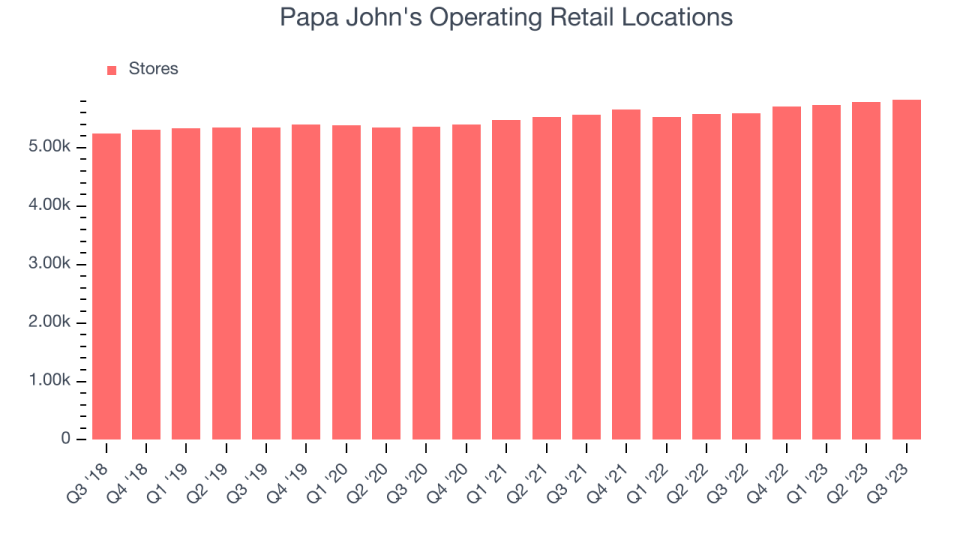
Taking a step back, Papa John's has opened new restaurants over the last eight quarters, averaging 2.45% annual increases in new locations. This growth outpaces the broader restaurant sector, but comparisons should be taken lightly as the industry is quite mature. Analyzing a restaurant's location growth is important because expansion means Papa John's has more opportunities to feed customers and generate sales.
Same-Store Sales
Same-store sales growth is a key performance indicator used to measure organic growth and demand for restaurants.
Papa John's demand within its existing restaurants has barely risen over the last eight quarters. On average, the company's same-store sales growth has been flat, or about 0.62% year on year.
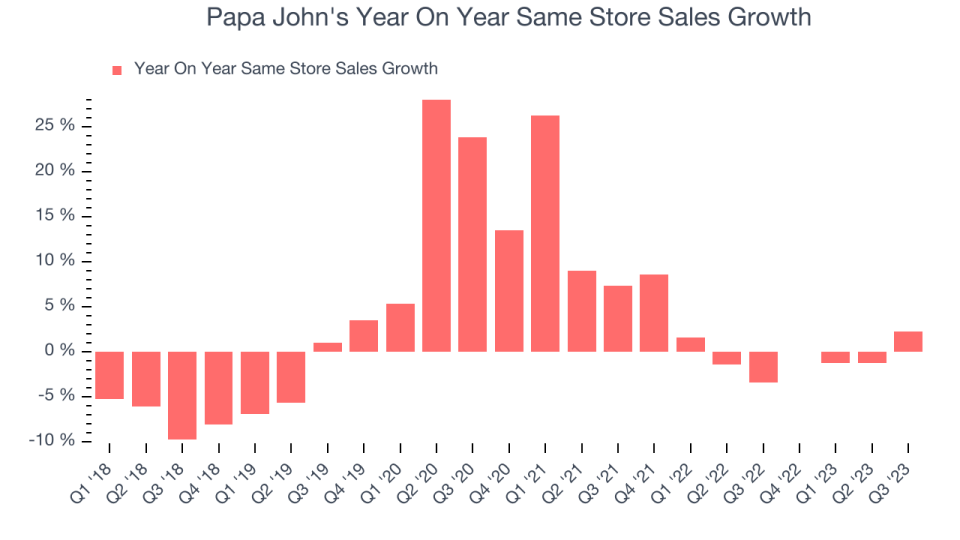
In the latest quarter, Papa John's same-store sales rose 2.2% year on year. This growth was a well-appreciated turnaround from the 3.4% year-on-year decline it posted 12 months ago, showing the business is regaining momentum.
Key Takeaways from Papa John's Q3 Results
With a market capitalization of $2.14 billion, Papa John's is among smaller companies, but its $37.5 million cash balance and positive free cash flow over the last 12 months give us confidence that it has the resources needed to pursue a high-growth business strategy.
Same store sales beat expectations, but revenue, EPS and free cash flow all missed. Overall, this was a mediocre quarter for Papa John's. The stock is up 1.16% after reporting and currently trades at $66 per share.
Papa John's may have had a tough quarter, but does that actually create an opportunity to invest right now? When making that decision, it's important to consider its valuation, business qualities, as well as what has happened in the latest quarter. We cover that in our actionable full research report which you can read here, it's free.
One way to find opportunities in the market is to watch for generational shifts in the economy. Almost every company is slowly finding itself becoming a technology company and facing cybersecurity risks and as a result, the demand for cloud-native cybersecurity is skyrocketing. This company is leading a massive technological shift in the industry and with revenue growth of 50% year on year and best-in-class SaaS metrics it should definitely be on your radar.
Join Paid Stock Investor Research
Help us make StockStory more helpful to investors like yourself. Join our paid user research session and receive a $50 Amazon gift card for your opinions. Sign up here.
The author has no position in any of the stocks mentioned in this report.
