The past year for Magic Software Enterprises (NASDAQ:MGIC) investors has not been profitable
It's easy to match the overall market return by buying an index fund. But if you buy individual stocks, you can do both better or worse than that. Investors in Magic Software Enterprises Ltd. (NASDAQ:MGIC) have tasted that bitter downside in the last year, as the share price dropped 44%. That falls noticeably short of the market return of around 15%. Even if you look out three years, the returns are still disappointing, with the share price down42% in that time. Furthermore, it's down 20% in about a quarter. That's not much fun for holders. We note that the company has reported results fairly recently; and the market is hardly delighted. You can check out the latest numbers in our company report.
So let's have a look and see if the longer term performance of the company has been in line with the underlying business' progress.
See our latest analysis for Magic Software Enterprises
To paraphrase Benjamin Graham: Over the short term the market is a voting machine, but over the long term it's a weighing machine. One imperfect but simple way to consider how the market perception of a company has shifted is to compare the change in the earnings per share (EPS) with the share price movement.
During the unfortunate twelve months during which the Magic Software Enterprises share price fell, it actually saw its earnings per share (EPS) improve by 20%. It could be that the share price was previously over-hyped.
It's surprising to see the share price fall so much, despite the improved EPS. So it's well worth checking out some other metrics, too.
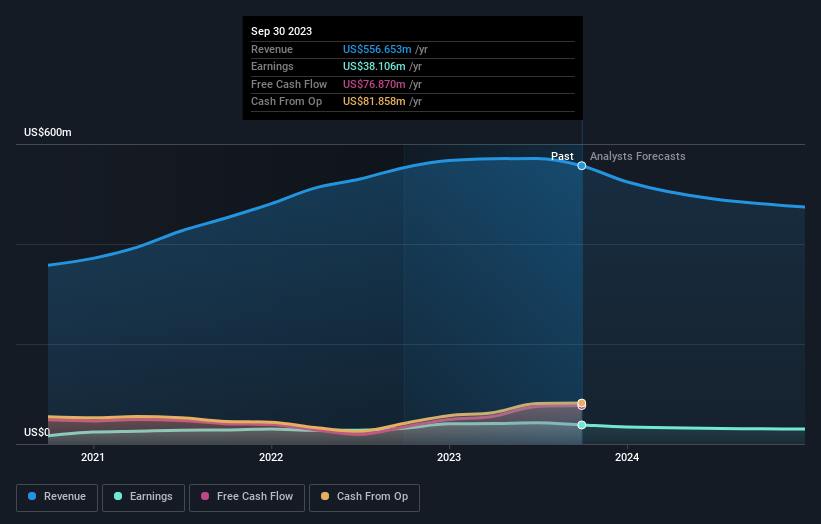
We don't see any weakness in the Magic Software Enterprises' dividend so the steady payout can't really explain the share price drop. From what we can see, revenue is pretty flat, so that doesn't really explain the share price drop. Of course, it could simply be that it simply fell short of the market consensus expectations.
The image below shows how earnings and revenue have tracked over time (if you click on the image you can see greater detail).
We know that Magic Software Enterprises has improved its bottom line over the last three years, but what does the future have in store? You can see how its balance sheet has strengthened (or weakened) over time in this free interactive graphic.
What About Dividends?
When looking at investment returns, it is important to consider the difference between total shareholder return (TSR) and share price return. The TSR incorporates the value of any spin-offs or discounted capital raisings, along with any dividends, based on the assumption that the dividends are reinvested. It's fair to say that the TSR gives a more complete picture for stocks that pay a dividend. As it happens, Magic Software Enterprises' TSR for the last 1 year was -41%, which exceeds the share price return mentioned earlier. The dividends paid by the company have thusly boosted the total shareholder return.
A Different Perspective
While the broader market gained around 15% in the last year, Magic Software Enterprises shareholders lost 41% (even including dividends). However, keep in mind that even the best stocks will sometimes underperform the market over a twelve month period. On the bright side, long term shareholders have made money, with a gain of 7% per year over half a decade. It could be that the recent sell-off is an opportunity, so it may be worth checking the fundamental data for signs of a long term growth trend. It's always interesting to track share price performance over the longer term. But to understand Magic Software Enterprises better, we need to consider many other factors. Like risks, for instance. Every company has them, and we've spotted 2 warning signs for Magic Software Enterprises (of which 1 is a bit concerning!) you should know about.
We will like Magic Software Enterprises better if we see some big insider buys. While we wait, check out this free list of growing companies with considerable, recent, insider buying.
Please note, the market returns quoted in this article reflect the market weighted average returns of stocks that currently trade on American exchanges.
Have feedback on this article? Concerned about the content? Get in touch with us directly. Alternatively, email editorial-team (at) simplywallst.com.
This article by Simply Wall St is general in nature. We provide commentary based on historical data and analyst forecasts only using an unbiased methodology and our articles are not intended to be financial advice. It does not constitute a recommendation to buy or sell any stock, and does not take account of your objectives, or your financial situation. We aim to bring you long-term focused analysis driven by fundamental data. Note that our analysis may not factor in the latest price-sensitive company announcements or qualitative material. Simply Wall St has no position in any stocks mentioned.
