The past three years for Charter Hall Long WALE REIT (ASX:CLW) investors has not been profitable
In order to justify the effort of selecting individual stocks, it's worth striving to beat the returns from a market index fund. But if you try your hand at stock picking, your risk returning less than the market. Unfortunately, that's been the case for longer term Charter Hall Long WALE REIT (ASX:CLW) shareholders, since the share price is down 22% in the last three years, falling well short of the market return of around 28%.
It's worthwhile assessing if the company's economics have been moving in lockstep with these underwhelming shareholder returns, or if there is some disparity between the two. So let's do just that.
See our latest analysis for Charter Hall Long WALE REIT
There is no denying that markets are sometimes efficient, but prices do not always reflect underlying business performance. One flawed but reasonable way to assess how sentiment around a company has changed is to compare the earnings per share (EPS) with the share price.
Over the three years that the share price declined, Charter Hall Long WALE REIT's earnings per share (EPS) dropped significantly, falling to a loss. Since the company has fallen to a loss making position, it's hard to compare the change in EPS with the share price change. However, we can say we'd expect to see a falling share price in this scenario.
The image below shows how EPS has tracked over time (if you click on the image you can see greater detail).
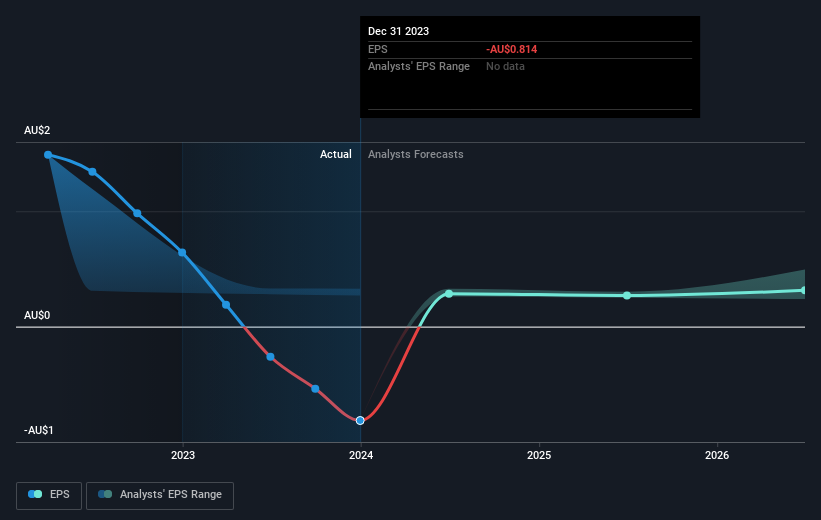
It might be well worthwhile taking a look at our free report on Charter Hall Long WALE REIT's earnings, revenue and cash flow.
What About Dividends?
As well as measuring the share price return, investors should also consider the total shareholder return (TSR). The TSR is a return calculation that accounts for the value of cash dividends (assuming that any dividend received was reinvested) and the calculated value of any discounted capital raisings and spin-offs. Arguably, the TSR gives a more comprehensive picture of the return generated by a stock. In the case of Charter Hall Long WALE REIT, it has a TSR of -5.2% for the last 3 years. That exceeds its share price return that we previously mentioned. And there's no prize for guessing that the dividend payments largely explain the divergence!
A Different Perspective
Investors in Charter Hall Long WALE REIT had a tough year, with a total loss of 4.4% (including dividends), against a market gain of about 17%. However, keep in mind that even the best stocks will sometimes underperform the market over a twelve month period. On the bright side, long term shareholders have made money, with a gain of 2% per year over half a decade. If the fundamental data continues to indicate long term sustainable growth, the current sell-off could be an opportunity worth considering. It's always interesting to track share price performance over the longer term. But to understand Charter Hall Long WALE REIT better, we need to consider many other factors. For instance, we've identified 2 warning signs for Charter Hall Long WALE REIT that you should be aware of.
If you would prefer to check out another company -- one with potentially superior financials -- then do not miss this free list of companies that have proven they can grow earnings.
Please note, the market returns quoted in this article reflect the market weighted average returns of stocks that currently trade on Australian exchanges.
Have feedback on this article? Concerned about the content? Get in touch with us directly. Alternatively, email editorial-team (at) simplywallst.com.
This article by Simply Wall St is general in nature. We provide commentary based on historical data and analyst forecasts only using an unbiased methodology and our articles are not intended to be financial advice. It does not constitute a recommendation to buy or sell any stock, and does not take account of your objectives, or your financial situation. We aim to bring you long-term focused analysis driven by fundamental data. Note that our analysis may not factor in the latest price-sensitive company announcements or qualitative material. Simply Wall St has no position in any stocks mentioned.
