The past three years for Tredegar (NYSE:TG) investors has not been profitable
As an investor its worth striving to ensure your overall portfolio beats the market average. But in any portfolio, there are likely to be some stocks that fall short of that benchmark. Unfortunately, that's been the case for longer term Tredegar Corporation (NYSE:TG) shareholders, since the share price is down 40% in the last three years, falling well short of the market return of around 35%. Furthermore, it's down 14% in about a quarter. That's not much fun for holders. However, one could argue that the price has been influenced by the general market, which is down 8.2% in the same timeframe.
Now let's have a look at the company's fundamentals, and see if the long term shareholder return has matched the performance of the underlying business.
View our latest analysis for Tredegar
To quote Buffett, 'Ships will sail around the world but the Flat Earth Society will flourish. There will continue to be wide discrepancies between price and value in the marketplace...' One way to examine how market sentiment has changed over time is to look at the interaction between a company's share price and its earnings per share (EPS).
Although the share price is down over three years, Tredegar actually managed to grow EPS by 34% per year in that time. Given the share price reaction, one might suspect that EPS is not a good guide to the business performance during the period (perhaps due to a one-off loss or gain). Alternatively, growth expectations may have been unreasonable in the past.
Since the change in EPS doesn't seem to correlate with the change in share price, it's worth taking a look at other metrics.
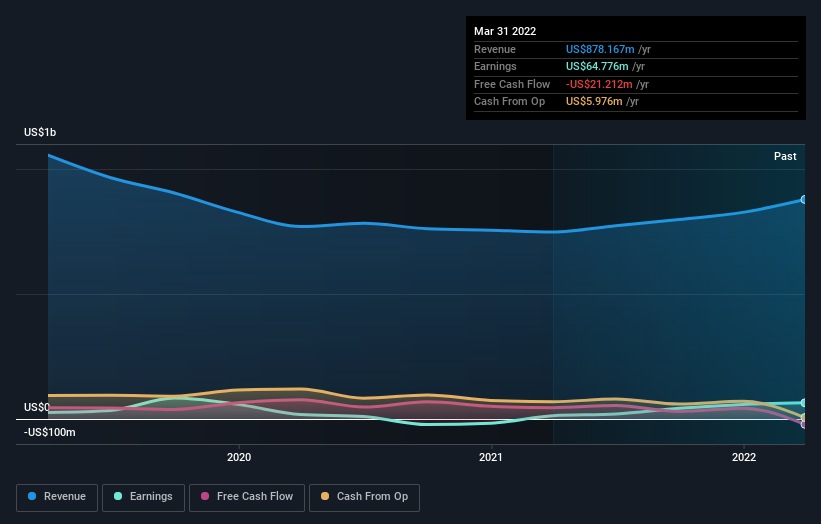
Given the healthiness of the dividend payments, we doubt that they've concerned the market. However, the weak share price might be related to the fact revenue has been disappearing at a rate of 6.3% each year, over three years. In that case, the current EPS might be viewed by some as difficult to sustain.
You can see how earnings and revenue have changed over time in the image below (click on the chart to see the exact values).
Take a more thorough look at Tredegar's financial health with this free report on its balance sheet.
What About Dividends?
It is important to consider the total shareholder return, as well as the share price return, for any given stock. The TSR incorporates the value of any spin-offs or discounted capital raisings, along with any dividends, based on the assumption that the dividends are reinvested. It's fair to say that the TSR gives a more complete picture for stocks that pay a dividend. In the case of Tredegar, it has a TSR of -7.0% for the last 3 years. That exceeds its share price return that we previously mentioned. And there's no prize for guessing that the dividend payments largely explain the divergence!
A Different Perspective
The total return of 16% received by Tredegar shareholders over the last year isn't far from the market return of -15%. Longer term investors wouldn't be so upset, since they would have made 1.8%, each year, over five years. If the stock price has been impacted by changing sentiment, rather than deteriorating business conditions, it could spell opportunity. While it is well worth considering the different impacts that market conditions can have on the share price, there are other factors that are even more important. Even so, be aware that Tredegar is showing 4 warning signs in our investment analysis , and 3 of those are potentially serious...
Of course, you might find a fantastic investment by looking elsewhere. So take a peek at this free list of companies we expect will grow earnings.
Please note, the market returns quoted in this article reflect the market weighted average returns of stocks that currently trade on US exchanges.
Have feedback on this article? Concerned about the content? Get in touch with us directly. Alternatively, email editorial-team (at) simplywallst.com.
This article by Simply Wall St is general in nature. We provide commentary based on historical data and analyst forecasts only using an unbiased methodology and our articles are not intended to be financial advice. It does not constitute a recommendation to buy or sell any stock, and does not take account of your objectives, or your financial situation. We aim to bring you long-term focused analysis driven by fundamental data. Note that our analysis may not factor in the latest price-sensitive company announcements or qualitative material. Simply Wall St has no position in any stocks mentioned.
Join A Paid User Research Session
You’ll receive a US$30 Amazon Gift card for 1 hour of your time while helping us build better investing tools for the individual investors like yourself. Sign up here
