Pathward Financial's (NASDAQ:CASH) five-year earnings growth trails the 21% YoY shareholder returns
The worst result, after buying shares in a company (assuming no leverage), would be if you lose all the money you put in. But when you pick a company that is really flourishing, you can make more than 100%. One great example is Pathward Financial, Inc. (NASDAQ:CASH) which saw its share price drive 150% higher over five years. In more good news, the share price has risen 8.4% in thirty days. But this could be related to good market conditions -- stocks in its market are up 4.2% in the last month.
After a strong gain in the past week, it's worth seeing if longer term returns have been driven by improving fundamentals.
View our latest analysis for Pathward Financial
While the efficient markets hypothesis continues to be taught by some, it has been proven that markets are over-reactive dynamic systems, and investors are not always rational. One flawed but reasonable way to assess how sentiment around a company has changed is to compare the earnings per share (EPS) with the share price.
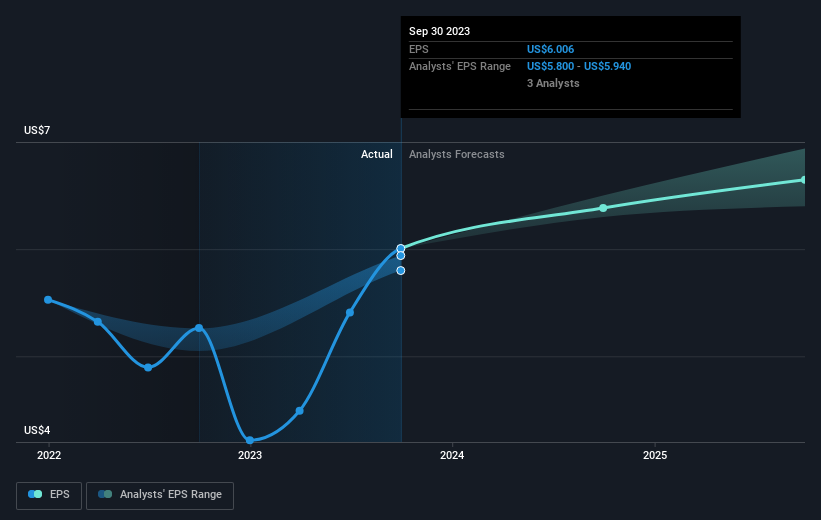
Over half a decade, Pathward Financial managed to grow its earnings per share at 30% a year. This EPS growth is higher than the 20% average annual increase in the share price. So one could conclude that the broader market has become more cautious towards the stock. This cautious sentiment is reflected in its (fairly low) P/E ratio of 8.36.
The company's earnings per share (over time) is depicted in the image below (click to see the exact numbers).
We consider it positive that insiders have made significant purchases in the last year. Even so, future earnings will be far more important to whether current shareholders make money. This free interactive report on Pathward Financial's earnings, revenue and cash flow is a great place to start, if you want to investigate the stock further.
What About Dividends?
It is important to consider the total shareholder return, as well as the share price return, for any given stock. Whereas the share price return only reflects the change in the share price, the TSR includes the value of dividends (assuming they were reinvested) and the benefit of any discounted capital raising or spin-off. It's fair to say that the TSR gives a more complete picture for stocks that pay a dividend. We note that for Pathward Financial the TSR over the last 5 years was 157%, which is better than the share price return mentioned above. And there's no prize for guessing that the dividend payments largely explain the divergence!
A Different Perspective
It's good to see that Pathward Financial has rewarded shareholders with a total shareholder return of 23% in the last twelve months. Of course, that includes the dividend. That's better than the annualised return of 21% over half a decade, implying that the company is doing better recently. Given the share price momentum remains strong, it might be worth taking a closer look at the stock, lest you miss an opportunity. I find it very interesting to look at share price over the long term as a proxy for business performance. But to truly gain insight, we need to consider other information, too. To that end, you should learn about the 2 warning signs we've spotted with Pathward Financial (including 1 which is a bit unpleasant) .
Pathward Financial is not the only stock that insiders are buying. For those who like to find winning investments this free list of growing companies with recent insider purchasing, could be just the ticket.
Please note, the market returns quoted in this article reflect the market weighted average returns of stocks that currently trade on American exchanges.
Have feedback on this article? Concerned about the content? Get in touch with us directly. Alternatively, email editorial-team (at) simplywallst.com.
This article by Simply Wall St is general in nature. We provide commentary based on historical data and analyst forecasts only using an unbiased methodology and our articles are not intended to be financial advice. It does not constitute a recommendation to buy or sell any stock, and does not take account of your objectives, or your financial situation. We aim to bring you long-term focused analysis driven by fundamental data. Note that our analysis may not factor in the latest price-sensitive company announcements or qualitative material. Simply Wall St has no position in any stocks mentioned.
