Is Patrick Industries, Inc.'s (NASDAQ:PATK) Recent Stock Performance Tethered To Its Strong Fundamentals?
Most readers would already be aware that Patrick Industries' (NASDAQ:PATK) stock increased significantly by 41% over the past three months. Given the company's impressive performance, we decided to study its financial indicators more closely as a company's financial health over the long-term usually dictates market outcomes. In this article, we decided to focus on Patrick Industries' ROE.
ROE or return on equity is a useful tool to assess how effectively a company can generate returns on the investment it received from its shareholders. In other words, it is a profitability ratio which measures the rate of return on the capital provided by the company's shareholders.
View our latest analysis for Patrick Industries
How To Calculate Return On Equity?
ROE can be calculated by using the formula:
Return on Equity = Net Profit (from continuing operations) ÷ Shareholders' Equity
So, based on the above formula, the ROE for Patrick Industries is:
14% = US$143m ÷ US$1.0b (Based on the trailing twelve months to December 2023).
The 'return' is the yearly profit. So, this means that for every $1 of its shareholder's investments, the company generates a profit of $0.14.
What Is The Relationship Between ROE And Earnings Growth?
Thus far, we have learned that ROE measures how efficiently a company is generating its profits. We now need to evaluate how much profit the company reinvests or "retains" for future growth which then gives us an idea about the growth potential of the company. Generally speaking, other things being equal, firms with a high return on equity and profit retention, have a higher growth rate than firms that don’t share these attributes.
Patrick Industries' Earnings Growth And 14% ROE
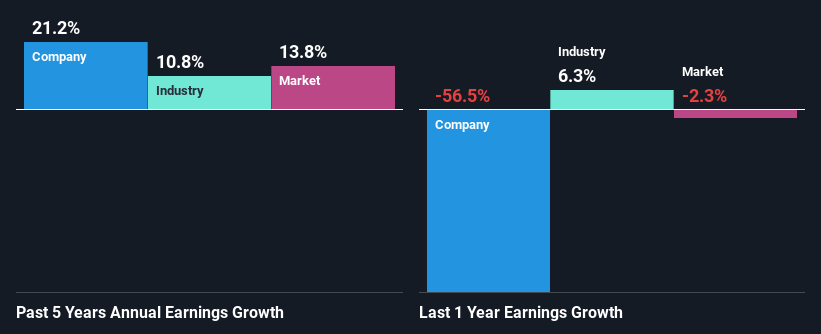
To start with, Patrick Industries' ROE looks acceptable. Further, the company's ROE is similar to the industry average of 12%. Consequently, this likely laid the ground for the impressive net income growth of 21% seen over the past five years by Patrick Industries. However, there could also be other drivers behind this growth. Such as - high earnings retention or an efficient management in place.
We then compared Patrick Industries' net income growth with the industry and we're pleased to see that the company's growth figure is higher when compared with the industry which has a growth rate of 11% in the same 5-year period.
The basis for attaching value to a company is, to a great extent, tied to its earnings growth. What investors need to determine next is if the expected earnings growth, or the lack of it, is already built into the share price. This then helps them determine if the stock is placed for a bright or bleak future. What is PATK worth today? The intrinsic value infographic in our free research report helps visualize whether PATK is currently mispriced by the market.
Is Patrick Industries Efficiently Re-investing Its Profits?
Patrick Industries' three-year median payout ratio to shareholders is 14%, which is quite low. This implies that the company is retaining 86% of its profits. This suggests that the management is reinvesting most of the profits to grow the business as evidenced by the growth seen by the company.
Besides, Patrick Industries has been paying dividends over a period of four years. This shows that the company is committed to sharing profits with its shareholders. Looking at the current analyst consensus data, we can see that the company's future payout ratio is expected to rise to 20% over the next three years.
Conclusion
In total, we are pretty happy with Patrick Industries' performance. In particular, it's great to see that the company is investing heavily into its business and along with a high rate of return, that has resulted in a sizeable growth in its earnings. The latest industry analyst forecasts show that the company is expected to maintain its current growth rate. To know more about the latest analysts predictions for the company, check out this visualization of analyst forecasts for the company.
Have feedback on this article? Concerned about the content? Get in touch with us directly. Alternatively, email editorial-team (at) simplywallst.com.
This article by Simply Wall St is general in nature. We provide commentary based on historical data and analyst forecasts only using an unbiased methodology and our articles are not intended to be financial advice. It does not constitute a recommendation to buy or sell any stock, and does not take account of your objectives, or your financial situation. We aim to bring you long-term focused analysis driven by fundamental data. Note that our analysis may not factor in the latest price-sensitive company announcements or qualitative material. Simply Wall St has no position in any stocks mentioned.
