Is Patterson Companies, Inc.'s (NASDAQ:PDCO) Recent Stock Performance Tethered To Its Strong Fundamentals?
Patterson Companies (NASDAQ:PDCO) has had a great run on the share market with its stock up by a significant 21% over the last three months. Given that the market rewards strong financials in the long-term, we wonder if that is the case in this instance. Particularly, we will be paying attention to Patterson Companies' ROE today.
Return on Equity or ROE is a test of how effectively a company is growing its value and managing investors’ money. In other words, it is a profitability ratio which measures the rate of return on the capital provided by the company's shareholders.
See our latest analysis for Patterson Companies
How To Calculate Return On Equity?
The formula for ROE is:
Return on Equity = Net Profit (from continuing operations) ÷ Shareholders' Equity
So, based on the above formula, the ROE for Patterson Companies is:
18% = US$207m ÷ US$1.1b (Based on the trailing twelve months to April 2023).
The 'return' is the yearly profit. So, this means that for every $1 of its shareholder's investments, the company generates a profit of $0.18.
What Is The Relationship Between ROE And Earnings Growth?
So far, we've learned that ROE is a measure of a company's profitability. Depending on how much of these profits the company reinvests or "retains", and how effectively it does so, we are then able to assess a company’s earnings growth potential. Assuming everything else remains unchanged, the higher the ROE and profit retention, the higher the growth rate of a company compared to companies that don't necessarily bear these characteristics.
Patterson Companies' Earnings Growth And 18% ROE
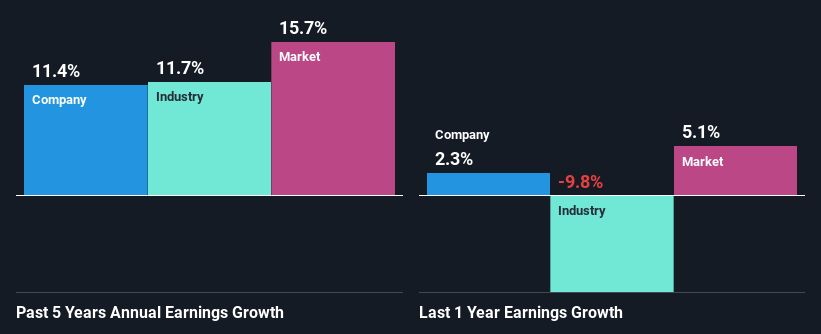
To begin with, Patterson Companies seems to have a respectable ROE. Especially when compared to the industry average of 11% the company's ROE looks pretty impressive. This certainly adds some context to Patterson Companies' decent 11% net income growth seen over the past five years.
We then performed a comparison between Patterson Companies' net income growth with the industry, which revealed that the company's growth is similar to the average industry growth of 12% in the same 5-year period.
Earnings growth is an important metric to consider when valuing a stock. The investor should try to establish if the expected growth or decline in earnings, whichever the case may be, is priced in. Doing so will help them establish if the stock's future looks promising or ominous. One good indicator of expected earnings growth is the P/E ratio which determines the price the market is willing to pay for a stock based on its earnings prospects. So, you may want to check if Patterson Companies is trading on a high P/E or a low P/E, relative to its industry.
Is Patterson Companies Using Its Retained Earnings Effectively?
The high three-year median payout ratio of 51% (or a retention ratio of 49%) for Patterson Companies suggests that the company's growth wasn't really hampered despite it returning most of its income to its shareholders.
Besides, Patterson Companies has been paying dividends for at least ten years or more. This shows that the company is committed to sharing profits with its shareholders. Existing analyst estimates suggest that the company's future payout ratio is expected to drop to 38% over the next three years. Despite the lower expected payout ratio, the company's ROE is not expected to change by much.
Summary
Overall, we are quite pleased with Patterson Companies' performance. We are particularly impressed by the considerable earnings growth posted by the company, which was likely backed by its high ROE. While the company is paying out most of its earnings as dividends, it has been able to grow its earnings in spite of it, so that's probably a good sign. With that said, the latest industry analyst forecasts reveal that the company's earnings growth is expected to slow down. To know more about the company's future earnings growth forecasts take a look at this free report on analyst forecasts for the company to find out more.
Have feedback on this article? Concerned about the content? Get in touch with us directly. Alternatively, email editorial-team (at) simplywallst.com.
This article by Simply Wall St is general in nature. We provide commentary based on historical data and analyst forecasts only using an unbiased methodology and our articles are not intended to be financial advice. It does not constitute a recommendation to buy or sell any stock, and does not take account of your objectives, or your financial situation. We aim to bring you long-term focused analysis driven by fundamental data. Note that our analysis may not factor in the latest price-sensitive company announcements or qualitative material. Simply Wall St has no position in any stocks mentioned.
Join A Paid User Research Session
You’ll receive a US$30 Amazon Gift card for 1 hour of your time while helping us build better investing tools for the individual investors like yourself. Sign up here
