Is Patterson-UTI Energy (PTEN) Too Good to Be True? A Comprehensive Analysis of a Potential ...
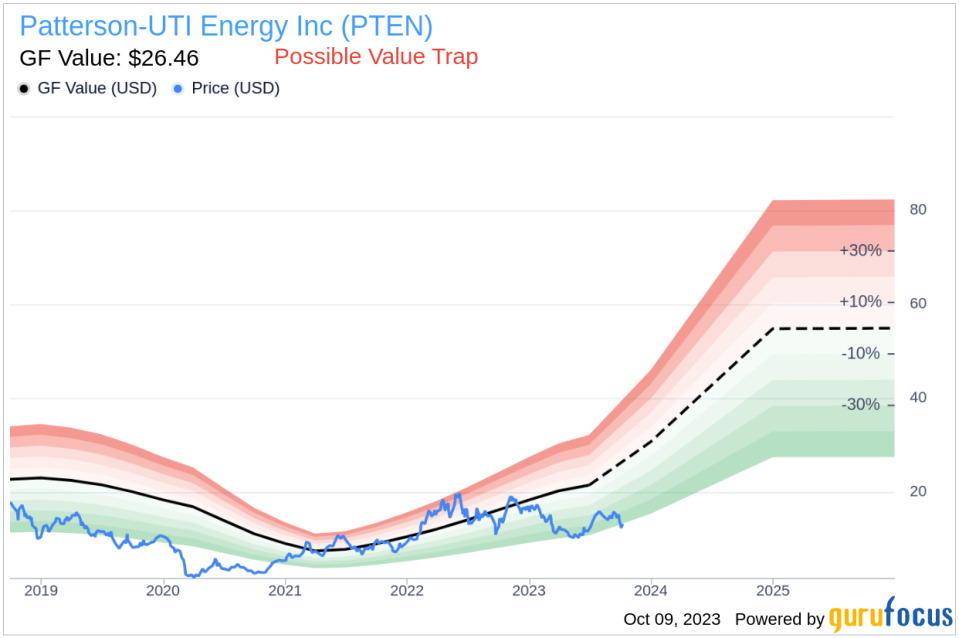
Value-focused investors are always on the hunt for stocks that are priced below their intrinsic value. One such stock that merits attention is Patterson-UTI Energy Inc (NASDAQ:PTEN). The stock, which is currently priced at 13.15, recorded a gain of 6.74% in a day and a 3-month increase of 2.32%. The stock's fair valuation is $26.46, as indicated by its GF Value.
Understanding the GF Value
The GF Value represents the current intrinsic value of a stock derived from our exclusive method. The GF Value Line on our summary page gives an overview of the fair value that the stock should be traded at. It is calculated based on three factors:
1. Historical multiples (PE Ratio, PS Ratio, PB Ratio and Price-to-Free-Cash-Flow) that the stock has traded at.
2. GuruFocus adjustment factor based on the company's past returns and growth.
3. Future estimates of the business performance.
We believe the GF Value Line is the fair value that the stock should be traded at. The stock price will most likely fluctuate around the GF Value Line. If the stock price is significantly above the GF Value Line, it is overvalued and its future return is likely to be poor. On the other hand, if it is significantly below the GF Value Line, its future return will likely be higher.
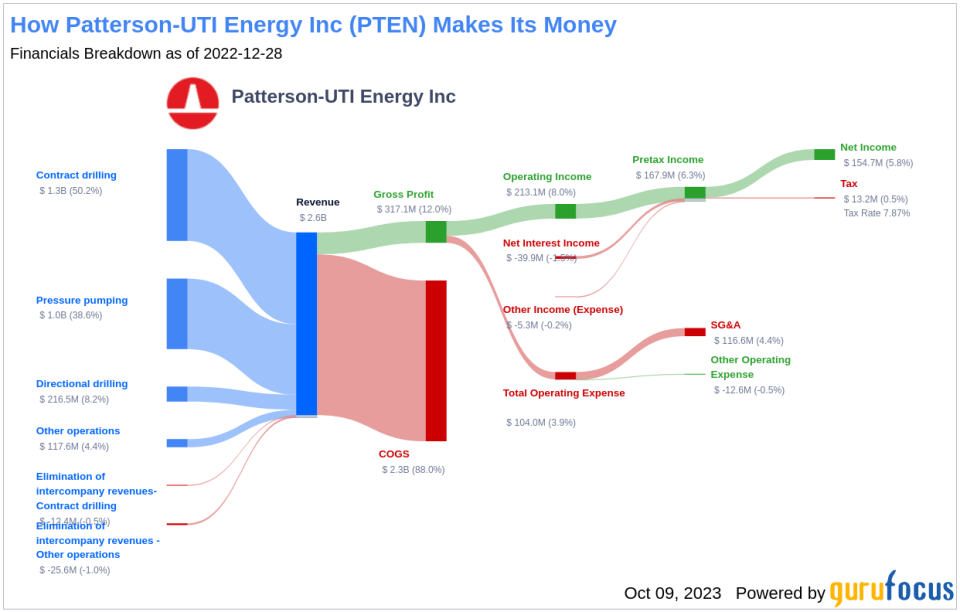
Unveiling Patterson-UTI Energy
Patterson-UTI Energy is one of the largest land rig drilling contractors in the United States and maintains moderately sized pressure-pumping operations primarily in Texas and the Appalachian region, plus some modest operations in Colombia. It also provides directional drilling services and tool rental services in most U.S. onshore oil and gas basins. Despite its seemingly attractive valuation, certain risk factors associated with Patterson-UTI Energy should not be ignored.
The Bearish Signs: Declining Revenues and Earnings
In the case of Patterson-UTI Energy, both the revenue per share (evident from the last five years' TTM data: 2019: 14.25; 2020: 9.23; 2021: 5.12; 2022: 9.26; 2023: 14.19; ) and the 5-year revenue growth rate (-8.1%) have been on a consistent downward trajectory. This pattern may point to underlying challenges such as diminishing demand for Patterson-UTI Energy's products, or escalating competition in its market sector. Either scenario can pose serious risks to the company's future performance, warranting a thorough analysis by investors.
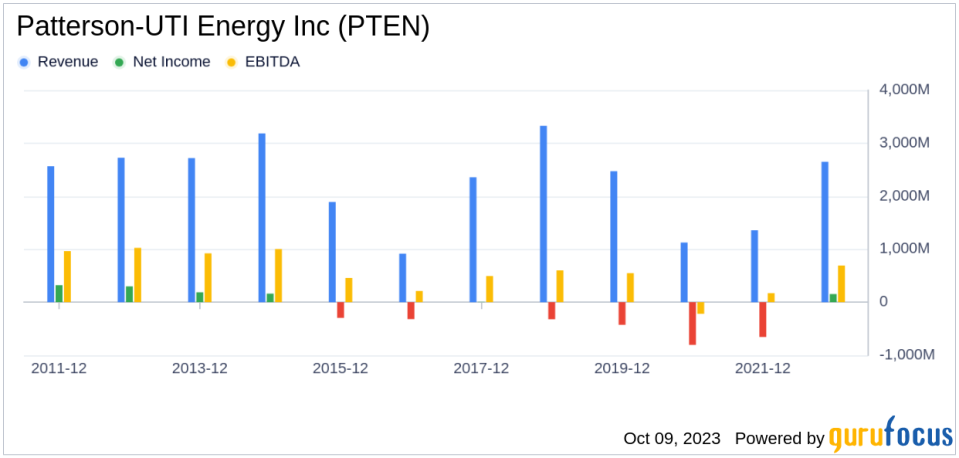
The Red Flag: Sluggish Earnings Growth
Despite its low price-to-fair-value ratio, Patterson-UTI Energy's falling revenues and earnings cast a long shadow over its investment attractiveness. A low price relative to intrinsic value can indeed suggest an investment opportunity, but only if the company's fundamentals are sound or improving. In Steelcase's case, the declining revenues, EBITDA, and earnings growth suggest that the company's issues may be more than just cyclical fluctuations.
Conclusion
Without a clear turnaround strategy, there's a risk that the company's performance could continue to deteriorate, leading to further price declines. In such a scenario, the low price-to-GF-Value ratio may be more indicative of a value trap than a value opportunity. Investors can find stocks with good revenue and earnings growth using GuruFocus' Peter Lynch Growth with Low Valuation Screener.
This article, generated by GuruFocus, is designed to provide general insights and is not tailored financial advice. Our commentary is rooted in historical data and analyst projections, utilizing an impartial methodology, and is not intended to serve as specific investment guidance. It does not formulate a recommendation to purchase or divest any stock and does not consider individual investment objectives or financial circumstances. Our objective is to deliver long-term, fundamental data-driven analysis. Be aware that our analysis might not incorporate the most recent, price-sensitive company announcements or qualitative information. GuruFocus holds no position in the stocks mentioned herein.
This article first appeared on GuruFocus.
