Pennon Group (LON:PNN) shareholders have lost 32% over 3 years, earnings decline likely the culprit
As an investor its worth striving to ensure your overall portfolio beats the market average. But in any portfolio, there are likely to be some stocks that fall short of that benchmark. We regret to report that long term Pennon Group Plc (LON:PNN) shareholders have had that experience, with the share price dropping 58% in three years, versus a market return of about 26%. And the ride hasn't got any smoother in recent times over the last year, with the price 35% lower in that time. The falls have accelerated recently, with the share price down 23% in the last three months.
Given the past week has been tough on shareholders, let's investigate the fundamentals and see what we can learn.
See our latest analysis for Pennon Group
Given that Pennon Group only made minimal earnings in the last twelve months, we'll focus on revenue to gauge its business development. Generally speaking, we'd consider a stock like this alongside loss-making companies, simply because the quantum of the profit is so low. It would be hard to believe in a more profitable future without growing revenues.
In the last three years, Pennon Group saw its revenue grow by 12% per year, compound. That's a pretty good rate of top-line growth. That contrasts with the weak share price, which has fallen 17% compounded, over three years. To be frank we're surprised to see revenue growth and share price growth diverge so strongly. It would be well worth taking a closer look at the company, to determine growth trends (and balance sheet strength).
The image below shows how earnings and revenue have tracked over time (if you click on the image you can see greater detail).
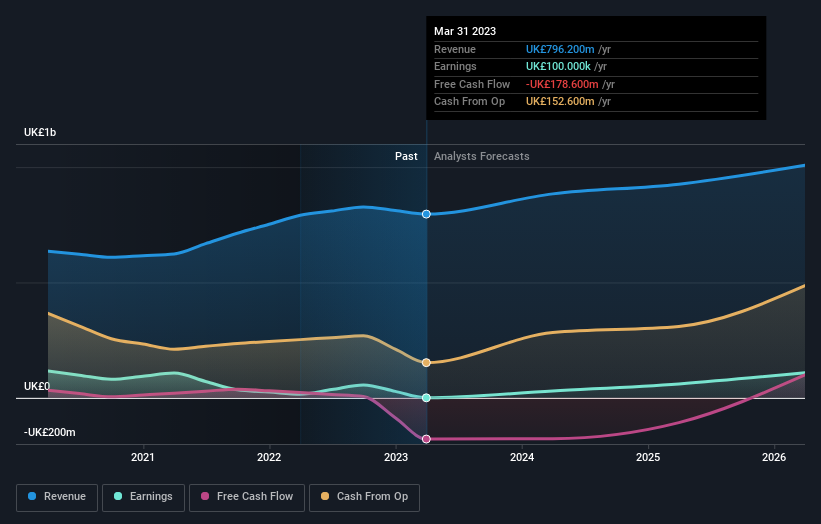
We're pleased to report that the CEO is remunerated more modestly than most CEOs at similarly capitalized companies. But while CEO remuneration is always worth checking, the really important question is whether the company can grow earnings going forward. So it makes a lot of sense to check out what analysts think Pennon Group will earn in the future (free profit forecasts).
What About Dividends?
As well as measuring the share price return, investors should also consider the total shareholder return (TSR). Whereas the share price return only reflects the change in the share price, the TSR includes the value of dividends (assuming they were reinvested) and the benefit of any discounted capital raising or spin-off. So for companies that pay a generous dividend, the TSR is often a lot higher than the share price return. We note that for Pennon Group the TSR over the last 3 years was -32%, which is better than the share price return mentioned above. This is largely a result of its dividend payments!
A Different Perspective
Pennon Group shareholders are down 31% for the year (even including dividends), but the market itself is up 1.4%. Even the share prices of good stocks drop sometimes, but we want to see improvements in the fundamental metrics of a business, before getting too interested. Longer term investors wouldn't be so upset, since they would have made 0.7%, each year, over five years. If the fundamental data continues to indicate long term sustainable growth, the current sell-off could be an opportunity worth considering. I find it very interesting to look at share price over the long term as a proxy for business performance. But to truly gain insight, we need to consider other information, too. Take risks, for example - Pennon Group has 4 warning signs (and 2 which are potentially serious) we think you should know about.
If you like to buy stocks alongside management, then you might just love this free list of companies. (Hint: insiders have been buying them).
Please note, the market returns quoted in this article reflect the market weighted average returns of stocks that currently trade on British exchanges.
Have feedback on this article? Concerned about the content? Get in touch with us directly. Alternatively, email editorial-team (at) simplywallst.com.
This article by Simply Wall St is general in nature. We provide commentary based on historical data and analyst forecasts only using an unbiased methodology and our articles are not intended to be financial advice. It does not constitute a recommendation to buy or sell any stock, and does not take account of your objectives, or your financial situation. We aim to bring you long-term focused analysis driven by fundamental data. Note that our analysis may not factor in the latest price-sensitive company announcements or qualitative material. Simply Wall St has no position in any stocks mentioned.
