PennyMac Financial Services' (NYSE:PFSI) five-year earnings growth trails the 22% YoY shareholder returns
When you buy a stock there is always a possibility that it could drop 100%. But on the bright side, you can make far more than 100% on a really good stock. One great example is PennyMac Financial Services, Inc. (NYSE:PFSI) which saw its share price drive 156% higher over five years. Better yet, the share price has risen 4.3% in the last week. But this could be related to the buoyant market which is up about 3.0% in a week.
On the back of a solid 7-day performance, let's check what role the company's fundamentals have played in driving long term shareholder returns.
View our latest analysis for PennyMac Financial Services
To paraphrase Benjamin Graham: Over the short term the market is a voting machine, but over the long term it's a weighing machine. One imperfect but simple way to consider how the market perception of a company has shifted is to compare the change in the earnings per share (EPS) with the share price movement.
Over half a decade, PennyMac Financial Services managed to grow its earnings per share at 36% a year. The EPS growth is more impressive than the yearly share price gain of 21% over the same period. Therefore, it seems the market has become relatively pessimistic about the company. This cautious sentiment is reflected in its (fairly low) P/E ratio of 3.52.
You can see how EPS has changed over time in the image below (click on the chart to see the exact values).
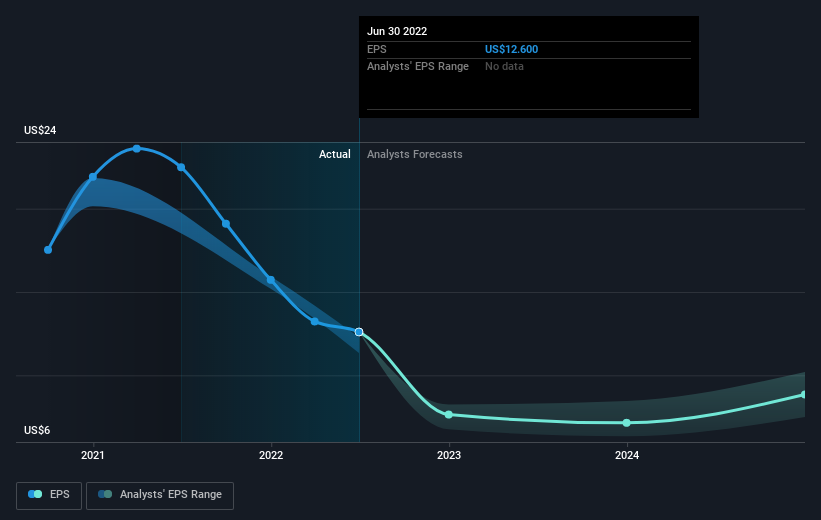
It is of course excellent to see how PennyMac Financial Services has grown profits over the years, but the future is more important for shareholders. This free interactive report on PennyMac Financial Services' balance sheet strength is a great place to start, if you want to investigate the stock further.
What About Dividends?
As well as measuring the share price return, investors should also consider the total shareholder return (TSR). The TSR is a return calculation that accounts for the value of cash dividends (assuming that any dividend received was reinvested) and the calculated value of any discounted capital raisings and spin-offs. It's fair to say that the TSR gives a more complete picture for stocks that pay a dividend. As it happens, PennyMac Financial Services' TSR for the last 5 years was 172%, which exceeds the share price return mentioned earlier. And there's no prize for guessing that the dividend payments largely explain the divergence!
A Different Perspective
PennyMac Financial Services shareholders are down 22% over twelve months (even including dividends), which isn't far from the market return of -21%. The silver lining is that longer term investors would have made a total return of 22% per year over half a decade. If the fundamental data remains strong, and the share price is simply down on sentiment, then this could be an opportunity worth investigating. I find it very interesting to look at share price over the long term as a proxy for business performance. But to truly gain insight, we need to consider other information, too. For example, we've discovered 3 warning signs for PennyMac Financial Services (1 can't be ignored!) that you should be aware of before investing here.
But note: PennyMac Financial Services may not be the best stock to buy. So take a peek at this free list of interesting companies with past earnings growth (and further growth forecast).
Please note, the market returns quoted in this article reflect the market weighted average returns of stocks that currently trade on US exchanges.
Have feedback on this article? Concerned about the content? Get in touch with us directly. Alternatively, email editorial-team (at) simplywallst.com.
This article by Simply Wall St is general in nature. We provide commentary based on historical data and analyst forecasts only using an unbiased methodology and our articles are not intended to be financial advice. It does not constitute a recommendation to buy or sell any stock, and does not take account of your objectives, or your financial situation. We aim to bring you long-term focused analysis driven by fundamental data. Note that our analysis may not factor in the latest price-sensitive company announcements or qualitative material. Simply Wall St has no position in any stocks mentioned.
Join A Paid User Research Session
You’ll receive a US$30 Amazon Gift card for 1 hour of your time while helping us build better investing tools for the individual investors like yourself. Sign up here
