Is Permian Basin Royalty Trust (PBT) Too Good to Be True? A Comprehensive Analysis of a ...
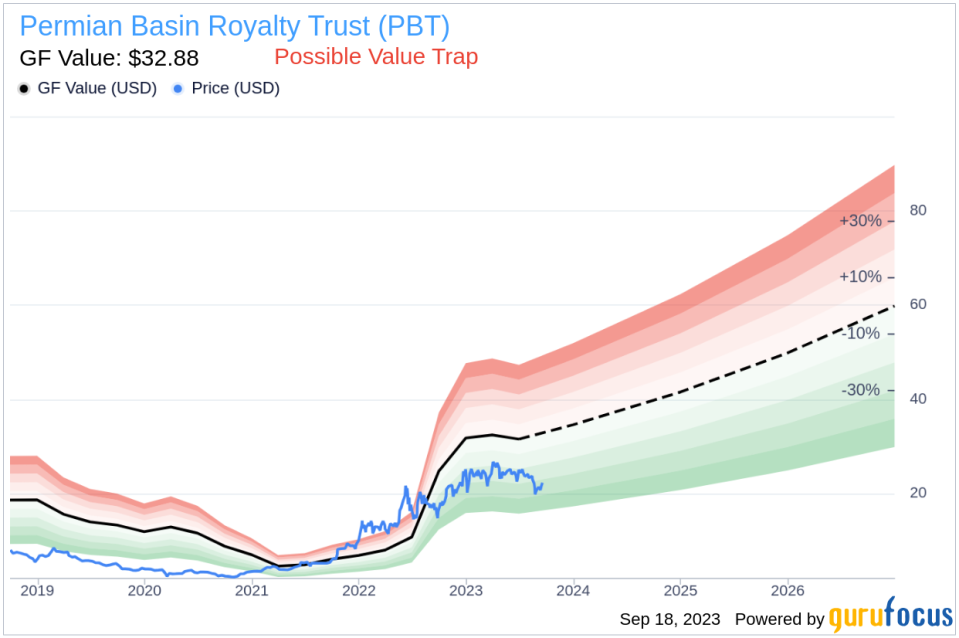
Value-focused investors are always on the hunt for stocks that are priced below their intrinsic value. One such stock that merits attention is Permian Basin Royalty Trust (NYSE:PBT). The stock, which is currently priced at 22.32, recorded a gain of 5.23% in a day and a 3-month decrease of 8.85%. The stock's fair valuation is $32.88, as indicated by its GF Value.
Understanding GF Value
The GF Value represents the current intrinsic value of a stock derived from our exclusive method. The GF Value Line on our summary page gives an overview of the fair value that the stock should be traded at. It is calculated based on three factors:
1. Historical multiples (PE Ratio, PS Ratio, PB Ratio and Price-to-Free-Cash-Flow) that the stock has traded at.
2. GuruFocus adjustment factor based on the company's past returns and growth.
3. Future estimates of the business performance.
We believe the GF Value Line is the fair value that the stock should be traded at. The stock price will most likely fluctuate around the GF Value Line. If the stock price is significantly above the GF Value Line, it is overvalued and its future return is likely to be poor. On the other hand, if it is significantly below the GF Value Line, its future return will likely be higher.
Assessing the Risks
However, investors need to consider a more in-depth analysis before making an investment decision. Despite its seemingly attractive valuation, certain risk factors associated with Permian Basin Royalty Trust should not be ignored. These risks are primarily reflected through its low and a Beneish M-Score of 79.97 that exceeds -1.78, the threshold for potential earnings manipulation. These indicators suggest that Permian Basin Royalty Trust, despite its apparent undervaluation, might be a potential value trap. This complexity underlines the importance of thorough due diligence in investment decision-making.
Understanding the Beneish M-Score
Developed by Professor Messod Beneish, the Beneish M-Score is based on eight financial variables that reflect different aspects of a company's financial performance and position. These are Days Sales Outstanding (DSO), Gross Margin (GM), Total Long-term Assets Less Property, Plant and Equipment over Total Assets (TATA), change in Revenue (?REV), change in Depreciation and Amortization (?DA), change in Selling, General and Admin expenses (?SGA), change in Debt-to-Asset Ratio (?LVG), and Net Income Less Non-Operating Income and Cash Flow from Operations over Total Assets (?NOATA).
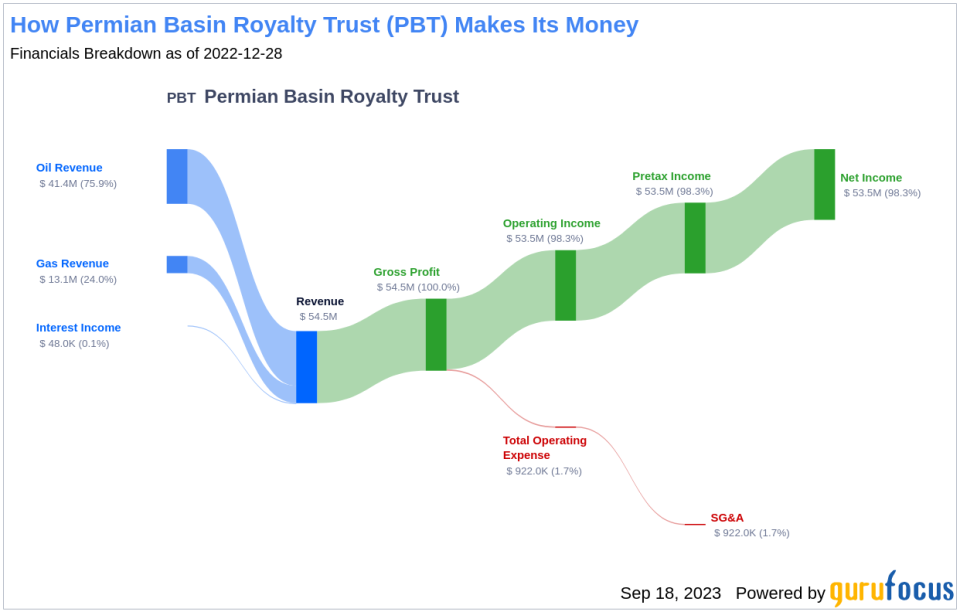
Company Overview
Permian Basin Royalty Trust is an express trust. The company's underlying properties include Waddell Ranch Properties in which the trust holds mineral interest as well as royalty interests in mature producing oil fields, such as Yates, Wasson, Sand Hills, East Texas, Kelly-Snyder, Panhandle Regular, N. Cowden, Todd, Keystone, Kermit, McElroy, Howard-Glasscock, Seminole and others across Texas. The company earns revenue in form of royalties received through its properties.
Examining the Gross Margin Index
The Gross Margin index tracks the evolution of a company's gross profit as a proportion of its revenue. A downward trend could indicate issues such as overproduction or more generous credit terms, both of which are potential red flags for earnings manipulation. By examining the past three years of Permian Basin Royalty Trust's historical data (2021: 0; 2022: 0; 2023: 0), we find that its Gross Margin has contracted by 0%. Such a contraction in the gross margin can negatively impact the company's profitability as it signifies lesser income from each dollar of sales. This could put a strain on the company's capacity to manage operating costs, potentially undermining its financial stability.
Evaluating the Year-Over-Year Change in Revenue
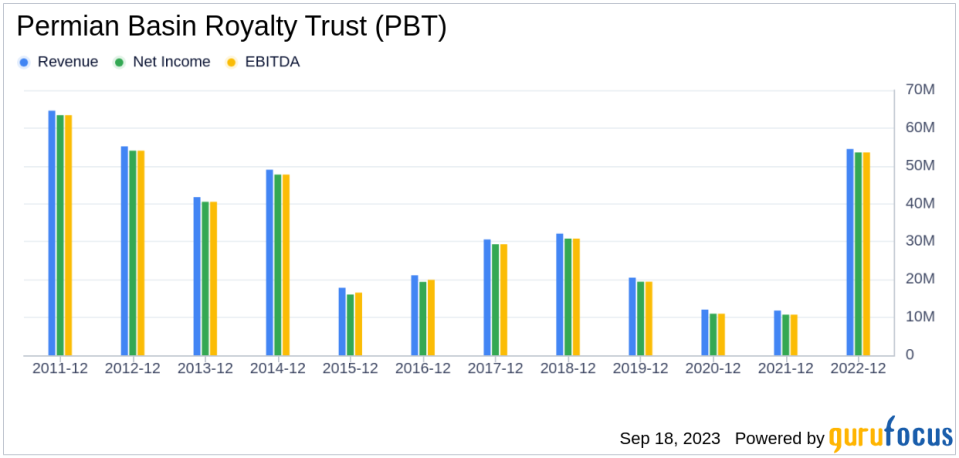
The Year-Over-Year (YoY) change in Revenue calculates the percentage difference in sales between the previous year and the current year. A notable upswing in this ratio could potentially signal aggressive income recognition or sales manipulation tactics. Delving into Permian Basin Royalty Trust's revenue data over the past three years (2021: 8.41; 2022: 18.45; 2023: 54.07), it's apparent that there has been a significant surge in revenue in the last 12 months, with a rise of 119.38 %.
Assessing the Change in Depreciation, Depletion, and Amortization
The change in Depreciation, Depletion, and Amortization (DDA) reflects the rate at which a company's assets lose value over time. Analyzing Permian Basin Royalty Trust's DDA data over the past three years (2021: 0; 2022: 0; 2023: 0), a decreasing rate might be a cause for concern. This decline may suggest that the company is prolonging the useful life of its assets, possibly to manipulate earnings. By extending the lifespan of assets, depreciation charges are spread over a longer period, thereby reducing annual expenses and artificially boosting reported profits. While this may create a more favorable short-term financial picture, it could also distort the true value and condition of the company's assets, misleading investors and potentially hiding underlying operational or financial issues.
Interpreting the Change in Selling, General, and Administrative Expenses
The change in Selling, General, and Administrative (SG&A) expenses provides insight into a company's operational costs, encompassing expenses related to selling products and managing the business. Examining Permian Basin Royalty Trust's SG&A data over the past three years (2021: 0.81; 2022: 1.14; 2023: 1.12), an unexpected decrease may raise eyebrows. While reducing these expenses can be a sign of improved efficiency, an abrupt or unexplained decrease might indicate cost-cutting measures taken to artificially inflate earnings. By selectively reducing SG&A expenses, a company can create the illusion of higher profitability and operational efficiency. However, if these reductions are achieved by neglecting essential functions like marketing, customer service, or quality control, it might result in long-term negative effects on the company's growth, reputation, and sustainability. Hence, a decrease in SG&A must be carefully evaluated within the broader context of the company's strategy, industry norms, and competitive landscape to determine if it signals potential earnings manipulation or a legitimate improvement in operational efficiency.
Understanding the TATA Ratio
The TATA (Total Accruals to Total Assets) ratio, calculated as the Net Income less Non-Operating Income and Cash Flow from Operations, divided by Total Assets, is a key indicator of the quality of a company's earnings. For Permian Basin Royalty Trust, the current TATA ratio (TTM) stands at 14.15. A positive TATA ratio can be a warning sign, suggesting that the earnings are composed more of accruals rather than cash flow, which could be an indication of aggressive income recognition. Accrual accounting permits management some discretion in recognizing revenue and expenses, and a company intent on artificially boosting its earnings might exploit this flexibility.
In essence, a higher TATA ratio might mean that the company's reported income is not as firmly grounded in real cash earnings, signaling poor quality of earnings, potentially resulting from accounting gimmicks or financial engineering rather than true operational performance. Investors and analysts should examine the components of the TATA ratio closely, especially when the value is positive, to understand the underlying drivers and assess whether it might indicate a need for more detailed scrutiny of the company's financial practices.
Conclusion
While Permian Basin Royalty Trust (NYSE:PBT) may seem like an attractive investment opportunity due to its undervaluation, the various risk factors and potential earnings manipulation indicators suggest that it could be a value trap. Therefore, investors should exercise due diligence and consider these risks before making an investment decision. To find out the high quality companies that may deliver above-average returns, please check out GuruFocus High Quality Low Capex Screener.
This article first appeared on GuruFocus.
