Is PGT Innovations, Inc.'s (NYSE:PGTI) P/E Ratio Really That Good?

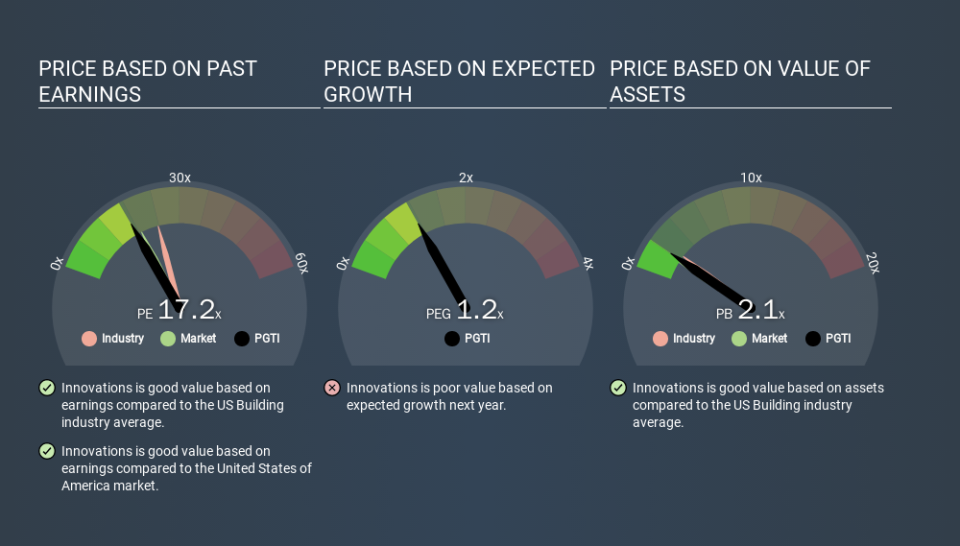
This article is written for those who want to get better at using price to earnings ratios (P/E ratios). We'll show how you can use PGT Innovations, Inc.'s (NYSE:PGTI) P/E ratio to inform your assessment of the investment opportunity. Based on the last twelve months, Innovations's P/E ratio is 17.18. In other words, at today's prices, investors are paying $17.18 for every $1 in prior year profit.
See our latest analysis for Innovations
How Do I Calculate A Price To Earnings Ratio?
The formula for price to earnings is:
Price to Earnings Ratio = Share Price ÷ Earnings per Share (EPS)
Or for Innovations:
P/E of 17.18 = $15.01 ÷ $0.87 (Based on the year to September 2019.)
Is A High Price-to-Earnings Ratio Good?
A higher P/E ratio implies that investors pay a higher price for the earning power of the business. All else being equal, it's better to pay a low price -- but as Warren Buffett said, 'It's far better to buy a wonderful company at a fair price than a fair company at a wonderful price.
How Does Innovations's P/E Ratio Compare To Its Peers?
The P/E ratio essentially measures market expectations of a company. We can see in the image below that the average P/E (23.9) for companies in the building industry is higher than Innovations's P/E.
This suggests that market participants think Innovations will underperform other companies in its industry. Since the market seems unimpressed with Innovations, it's quite possible it could surprise on the upside. If you consider the stock interesting, further research is recommended. For example, I often monitor director buying and selling.
How Growth Rates Impact P/E Ratios
Generally speaking the rate of earnings growth has a profound impact on a company's P/E multiple. Earnings growth means that in the future the 'E' will be higher. That means unless the share price increases, the P/E will reduce in a few years. Then, a lower P/E should attract more buyers, pushing the share price up.
Innovations saw earnings per share decrease by 31% last year. But over the longer term (5 years) earnings per share have increased by 17%.
A Limitation: P/E Ratios Ignore Debt and Cash In The Bank
The 'Price' in P/E reflects the market capitalization of the company. Thus, the metric does not reflect cash or debt held by the company. In theory, a company can lower its future P/E ratio by using cash or debt to invest in growth.
Such expenditure might be good or bad, in the long term, but the point here is that the balance sheet is not reflected by this ratio.
Innovations's Balance Sheet
Innovations has net debt equal to 33% of its market cap. While that's enough to warrant consideration, it doesn't really concern us.
The Bottom Line On Innovations's P/E Ratio
Innovations's P/E is 17.2 which is below average (18.7) in the US market. With only modest debt, it's likely the lack of EPS growth at least partially explains the pessimism implied by the P/E ratio.
When the market is wrong about a stock, it gives savvy investors an opportunity. As value investor Benjamin Graham famously said, 'In the short run, the market is a voting machine but in the long run, it is a weighing machine. So this free visual report on analyst forecasts could hold the key to an excellent investment decision.
But note: Innovations may not be the best stock to buy. So take a peek at this free list of interesting companies with strong recent earnings growth (and a P/E ratio below 20).
If you spot an error that warrants correction, please contact the editor at editorial-team@simplywallst.com. This article by Simply Wall St is general in nature. It does not constitute a recommendation to buy or sell any stock, and does not take account of your objectives, or your financial situation. Simply Wall St has no position in the stocks mentioned.
We aim to bring you long-term focused research analysis driven by fundamental data. Note that our analysis may not factor in the latest price-sensitive company announcements or qualitative material. Thank you for reading.
