Phreesia Inc (PHR): A Deep Dive into Its Performance Potential
Long-established in the Healthcare Providers & Services industry, Phreesia Inc (NYSE:PHR) has enjoyed a stellar reputation. However, it has recently witnessed a decline of 16.26%, juxtaposed with a three-month change of -22.15%. Fresh insights from the GuruFocus Score Rating hint at potential headwinds. Notably, its diminished rankings in financial strength, growth, and valuation suggest that the company might not live up to its historical performance. Join us as we dive deep into these pivotal metrics to unravel the evolving narrative of Phreesia Inc.
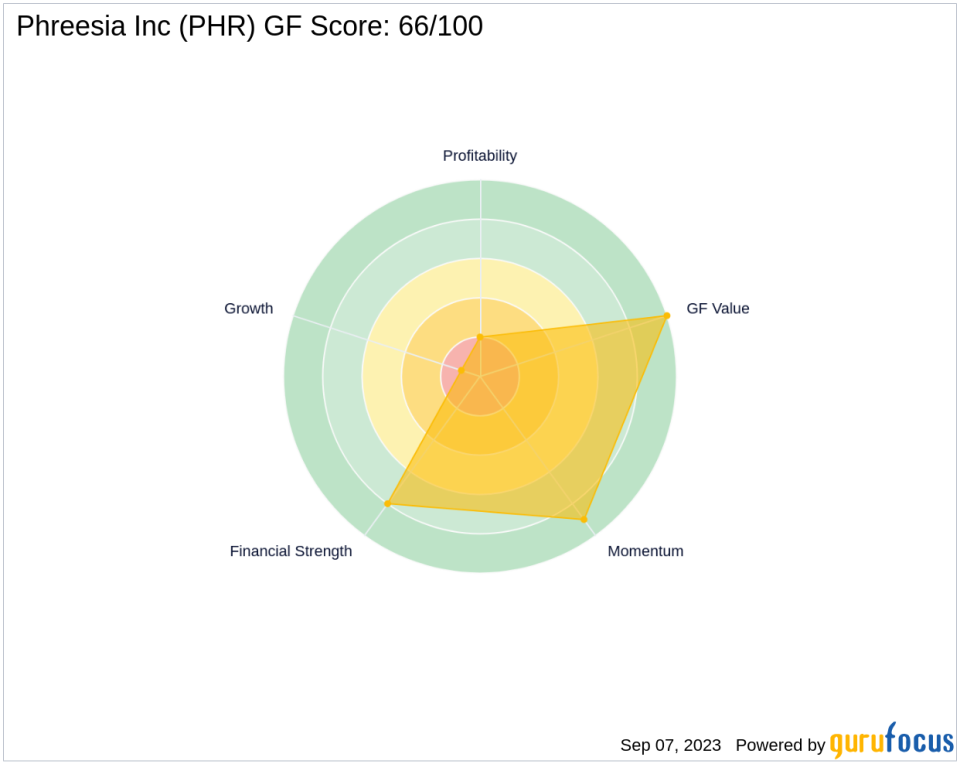
Understanding the GF Score
The GF Score is a stock performance ranking system developed by GuruFocus using five aspects of valuation, which has been found to be closely correlated to the long-term performances of stocks by backtesting from 2006 to 2021. The stocks with a higher GF Score generally generate higher returns than those with a lower GF Score. Therefore, when picking stocks, investors should invest in companies with high GF Scores. The GF Score ranges from 0 to 100, with 100 as the highest rank.
1. Financial strength rank: 8/10
2. Profitability rank: 2/10
3. Growth rank: 1/10
4. GF Value rank: 10/10
5. Momentum rank: 9/10
Based on the above method, GuruFocus assigned Phreesia Inc the GF Score of 66 out of 100, which signals poor future outperformance potential.
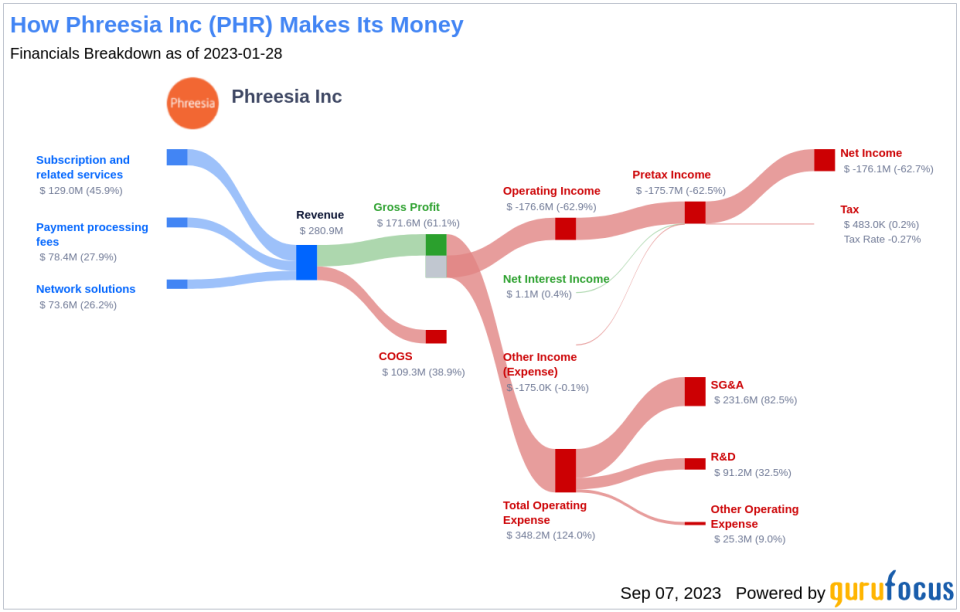
Phreesia Inc: A Snapshot of Its Business
Phreesia Inc, with a market cap of $1.4 billion and sales of $301.4 million, is a provider of comprehensive software solutions that improve the operational and financial performance of healthcare organizations by activating patients in their care to optimize patient health outcomes. Through its SaaS-based technology platform, it offers healthcare services clients a robust suite of integrated solutions that manage patient access, registration, payments, and clinical support. The Phreesia Platform encompasses a comprehensive range of technologies and services, including, but not limited to, initial patient contact, registration, appointment scheduling, payments, and post-appointment patient surveys.
Profitability Breakdown
Phreesia Inc's low Profitability rank can also raise warning signals. Phreesia Inc's Operating Margin has declined over the past five years ((-446,209.00%)), as shown by the following data: 2019: -9.51; 2020: -12.26; 2021: -17.27; 2022: -54.78; 2023: -62.85; .
Additionally, Phreesia Inc's Gross Margin has also declined over the past five years, as evidenced by the data: 2019: 62.96; 2020: 64.16; 2021: 64.77; 2022: 61.83; 2023: 61.10; . This trend underscores the company's struggles to convert its revenue into profits.
Growth Prospects
A lack of significant growth is another area where Phreesia Inc seems to falter, as evidenced by the company's low Growth rank. The company's revenue has declined by -4.5 per year over the past three years, which underperforms worse than 82.66% of 571 companies in the Healthcare Providers & Services industry. Stagnating revenues may pose concerns in a fast-evolving market.

Conclusion
Given Phreesia Inc's financial strength, profitability, and growth metrics, the GuruFocus Score Rating highlights the firm's unparalleled position for potential underperformance. While the company has a strong market presence, its declining profitability and growth rates may pose significant challenges in the future. Therefore, investors should exercise caution and conduct thorough research before making investment decisions.
GuruFocus Premium members can find more companies with strong GF Scores using the following screener link: GF Score Screen
This article first appeared on GuruFocus.
