Is Phreesia (PHR) Too Good to Be True? A Comprehensive Analysis of a Potential Value Trap
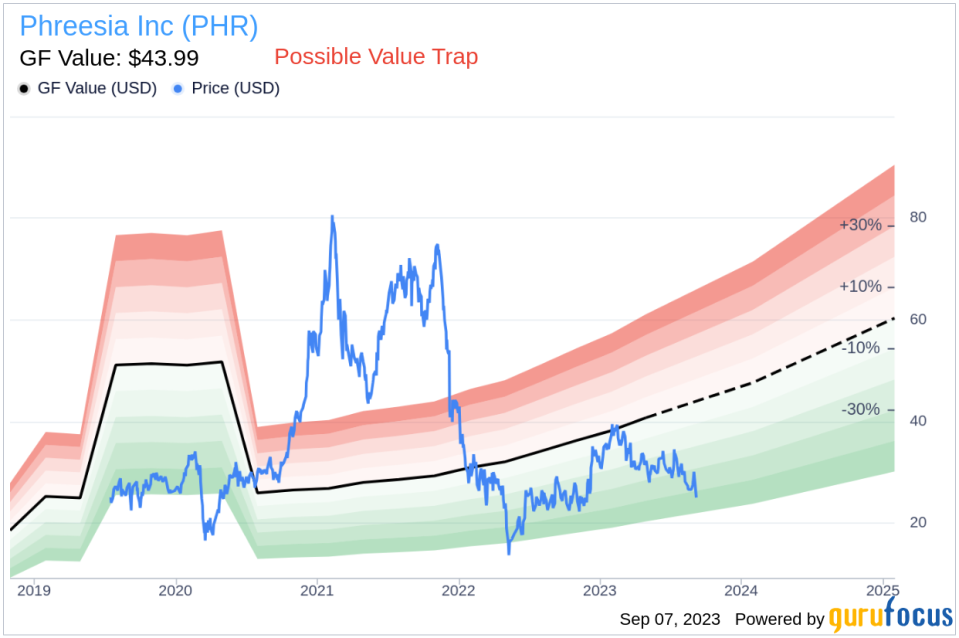
Value-focused investors are always on the hunt for stocks that are priced below their intrinsic value. One such stock that merits attention is Phreesia (NYSE:PHR). The stock, which is currently priced at 25.54, recorded a loss of 15.86% in a day and a 3-month decrease of 6.62%. The stock's fair valuation is $43.99, as indicated by its GF Value.
Understanding the GF Value
The GF Value represents the current intrinsic value of a stock derived from our exclusive method. The GF Value Line on our summary page gives an overview of the fair value that the stock should be traded at. It is calculated based on three factors: historical multiples (PE Ratio, PS Ratio, PB Ratio and Price-to-Free-Cash-Flow) that the stock has traded at, GuruFocus adjustment factor based on the company's past returns and growth, and future estimates of the business performance. We believe the GF Value Line is the fair value that the stock should be traded at. The stock price will most likely fluctuate around the GF Value Line.
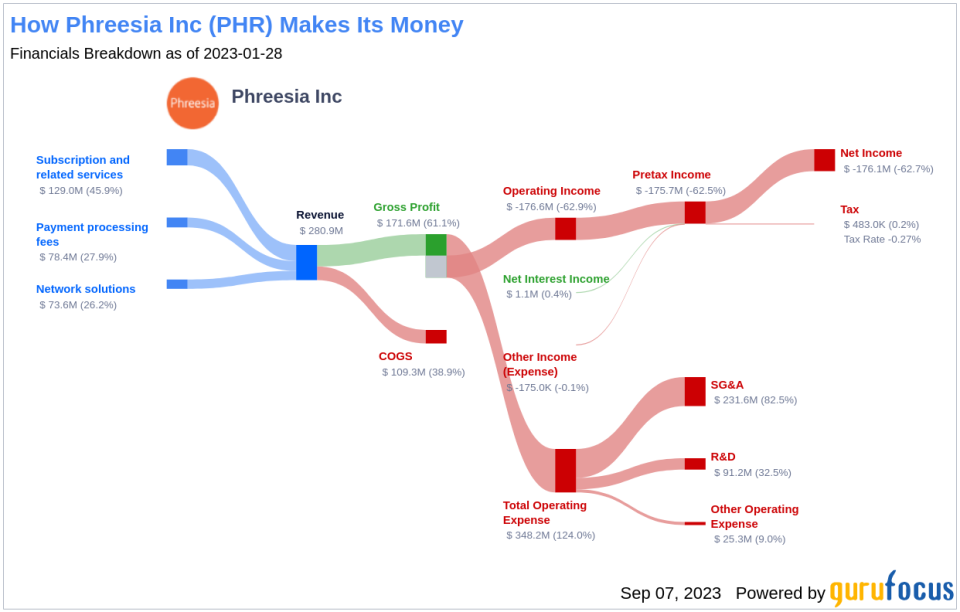
Phreesia Inc (NYSE:PHR): A Closer Look
Phreesia Inc is a provider of comprehensive software solutions that improve the operational and financial performance of healthcare organizations by activating patients in their care to optimize patient health outcomes. Through its SaaS-based technology platform, it offers healthcare services clients a robust suite of integrated solutions that manage patient access, registration, payments, and clinical support.
Bearish Signs: Declining Revenues and Earnings
One of the telltale indicators of a company's potential trouble is a sustained decline in revenues. In the case of Phreesia, both the revenue per share (evident from the last five years' TTM data: 2019: 3.50; 2020: 7.25; 2021: 3.93; 2022: 4.49; 2023: 5.71; ) and the 5-year revenue growth rate (-42.7%) have been on a consistent downward trajectory. This pattern may point to underlying challenges such as diminishing demand for Phreesia's products, or escalating competition in its market sector.
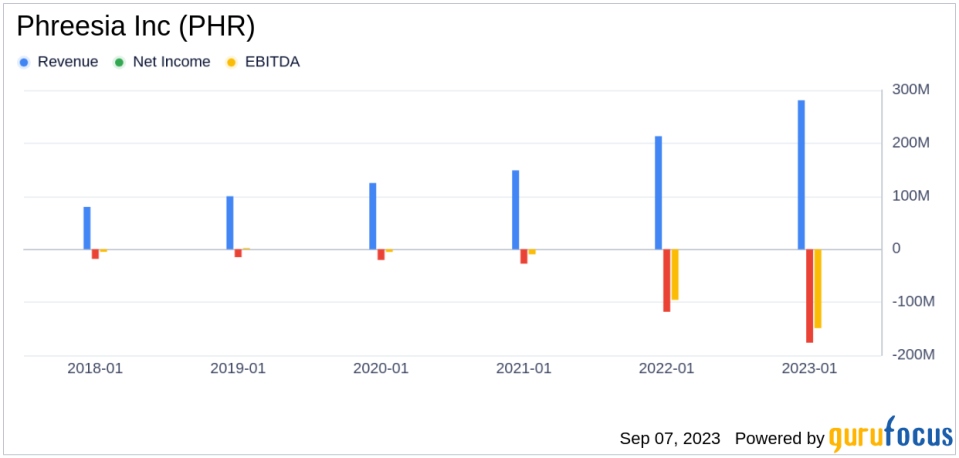
The Red Flag: Sluggish Earnings Growth
Despite its low price-to-fair-value ratio, Phreesia's falling revenues and earnings cast a long shadow over its investment attractiveness. A low price relative to intrinsic value can indeed suggest an investment opportunity, but only if the company's fundamentals are sound or improving. In Phreesia's case, the declining revenues, EBITDA, and earnings growth suggest that the company's issues may be more than just cyclical fluctuations.
Conclusion: A Potential Value Trap
Given the declining revenues and earnings, Phreesia might be a potential value trap. Without a clear turnaround strategy, there's a risk that the company's performance could continue to deteriorate, leading to further price declines. In such a scenario, the low price-to-GF-Value ratio may be more indicative of a value trap than a value opportunity. Therefore, investors are advised to exercise caution and conduct thorough due diligence before making an investment decision.
Investors can find stocks with good revenue and earnings growth using GuruFocus' Peter Lynch Growth with Low Valuation Screener.
This article first appeared on GuruFocus.
