Plutonic and Trident Mineral Resource & Ore Reserve Update

In this article:

Key Points

  • In June 2023, Catalyst acquired two companies to complete a consolidation of the Plutonic Gold Belt, a belt situated in northern WA

  • Previous owners of the belt had estimated Mineral Resources and Ore Reserves however, Catalyst felt a different estimation approach was needed

  • Since taking control, Catalyst has been undertaking this re-estimation process

  • These global Plutonic Resources include Resources for both the underground mine at Plutonic as well as the satellite development project, Trident

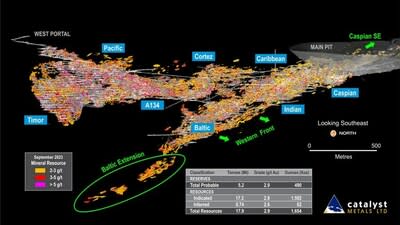
  • Mineral Resources and Ore Reserves for the Plutonic Main deposit are:

    • Indicated Resources: 17.2Mt at 2.9g/t Au for 1,592,000oz

    • Inferred Resources: 0.7Mt at 2.6g/t Au for 62,000oz

    • Reserves: 5.2Mt at 2.9g/t Au for 490,000oz

  • Resource and Reserve estimation has still not been undertaken by Catalyst on Plutonic East and the Hermes Area 

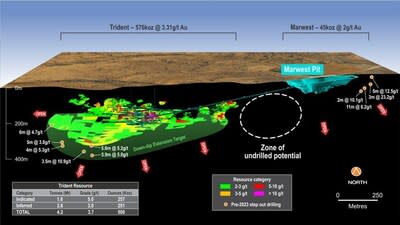
  • Mineral Resources for Trident are:

    • Indicated Resources: 1.6Mt at 5.0g/t Au for 257,000oz

    • Inferred Resources: 2.6Mt at 3.0g/t Au for 251,000oz

  • Trident resources have increased by 24% but grade has been reduced from the Vango estimates

  • Trident Definitive Feasibility Study is well progressed; Reserves expected to be released with this study in 2024

  • Release of this updated Mineral Resource estimate is an important step in Catalyst's process to rebuilding the foundations of the Plutonic Gold Belt. This release follows Catalyst's installation of a new operating team at the Plutonic gold mine. The combination of the two is responsible for the improved operating performance of the mine

PERTH, Australia, Dec. 6, 2023 /PRNewswire/ - Australian gold producer, Catalyst Metals Limited (Catalyst or the Company) (ASX: CYL) is pleased to provide an updated Mineral Resource & Ore Reserve statement for its Plutonic Gold Mine, and an updated Mineral Resource for the Trident deposit.

Importantly, the updates presented in this release relate to the Plutonic Main and Trident deposits only.  The Plutonic Gold Belt hosts numerous open pit and underground deposits that have previously been estimated by other competent persons. Those deposits are yet to be re-estimated.

Catalyst's MD & CEO, James Champion de Crespigny, said: "We are pleased to have this important body of work behind us. Such estimates are the foundation of any operation. This update provides our team with the comfort to execute on the mine plan.

The updated Trident Resource estimate is different than expected. It now reflects what Catalyst believe is an improved approach to estimating such a deposit, updated drilling and a lower cut-off grade in this higher gold price environment. This Resource will form the basis of the pending Trident Definitive Feasibility Study.  

That study is well progressed and the Company remains committed to its development as quickly as possible given its high grade and the latent mill capacity that currently exists at Plutonic.

Catalyst took control at Plutonic a little over five months ago and in that time there have been considerable changes. This is but another step in that transition plan as we set the company up for 2024."

Plutonic Underground Mineral Resources

The Mineral Resource & Ore Reserve sit within the existing mining footprint and do not include virgin zones.  Importantly, Table 1 below refers specifically to the Plutonic Main orebody and does not include any of the satellite deposits within the consolidated tenement package.  The previously reported NI 43-101 Ore Reserves and Mineral Resources for the Plutonic Operations included satellite deposits such as Plutonic East, Plutonic West, Hermes and Perch.  These remain NI 43-101 compliant, but not JORC compliant. Catalyst will review these estimates in due course.

The Mineral Resources and Ore Reserves for the Plutonic Underground Mine and Mineral Resources for the Trident deposit have been estimated for the first time by Catalyst following the acquisition of Superior Gold and Vango Mining.

Catalyst undertook a comprehensive re-estimation and classification of the entire Plutonic Main deposit Mineral Resources.  This included the Plutonic Main underground and open pit areas.  The previously reported Plutonic Main open pit Mineral Resources have now been incorporated into the Plutonic underground Mineral Resource inventory.  Further work is planned to re-evaluate the Plutonic Main open pit potential.

The re-estimation and classification of the Plutonic Mineral Resources followed an extensive review of the geological and geostatistical behaviour of the Plutonic mineralisation together with mine production reconciliation.  Catalyst has implemented a resource modelling technique that is well suited to estimating highly variable gold mineralisation.  The modelling parameters were optimised so that the final Mineral Resource was well aligned with recent and historic production reconciliation performance.

The Mineral Resource Estimate (MRE) for Plutonic Underground has been undertaken with a focus on delineating areas of the MRE with Reaonable Prospects for Eventual Economic Extraction (RPEEE).  Catalyst has applied a approach to historic mining depletion to ensure that the inclusion of potential 'un-mineable' remnants has been minimised.  In addition, an underground Shape Optimiser (SO) evaluation has been applied to ensure that only cohesive groups of blocks that satisfy RPEEE are included in the MRE.

The previous combined Measured, Indicated and Inferred NI 43-101 MRE as at 31 December 2021 for the Plutonic Main underground and open pit contained 4.97Moz.  Mine production depletion to 30 November 2023 accounts for 123Koz whilst changed modelling methodology, resource classification, historic depletion and RPEEE considerations has accounted for a reduction of 3.2Moz.  A high proportion of the resource reduction is due to a grade reduction from 4.6g/t Au (Measured and Indicated) and 5.2g/t (Inferred) to the current 2.9g/t Au (and 2.6g/t Au for Inferred).  Following is a summary of the Plutonic Underground Mineral Resources, as at 30 November 2023.

Table 1: Plutonic MRE (at 1.5g/t Au cut-off)

Classification

Tonnes (Mt)

Grade (g/t Au)

Ounces (Koz)

Indicated

17.2

2.9

1,592

Inferred

0.74

2.6

62

Total

17.9

2.9

1,654

Notes:


1.


Mineral Resource estimated at 1.5g/t Au cut-off and reported within underground Shape Optimiser (SO). SO inputs include:
Incremental Stope Mining Cost = AUD$60/t; Processing Costs = AUD$31/t ore; Site Administration Cost = AUD$23/t ore; Metallurgical Recovery = 84%; Royalties = 2.5%; Gold Price = AUD$2,800/oz; Minimum mining width = 3m

2.


Numbers may not add up due to rounding


Plutonic Underground Ore Reserves

Following is a summary of the Plutonic Underground Ore Reserves, as at 01 January 2024.

Table 2: Plutonic Ore Reserves

Classification

Tonnes (Mt)

Grade (g/t Au)

Ounces (Koz)

Probable

5.2

2.9

490

Total

5.2

2.9

490

Notes:


1.


Ore Reserve estimated at 2.0g/t Au cut-off;

2.


Reserves are a combination of detailed mine design and Stope Optimised shapes. SO inputs include: Incremental Stoping and Grade Control Cost = AUD$60/t; Processing Costs = AUD$31/t ore; Site Administration Cost = AUD$23/t ore; Metallurgical Recovery = 84%; Royalties = 2.5%; Gold Price = AUD$2,600/oz; Minimum mining width = 3m, with a 1m dilution halo applied to Hangingwall and Footwall.

3.


Mining modifying factors of 10% dilution is applied to the in-situ stope tonnes, and ore recovery of 95% is applied.

4.


Numbers may not add up due to rounding


As with the Mineral Resources, almost all of the reduction in ounces is due to a reduction of grade from 3.7g/t Au to 2.9g/t Au which is considered to be a more reliable estimate of mine grade going forward.

Trident Mineral Resources

The Trident deposit sits approximately 25km to the north-east of the Plutonic Gold Mine and the planned development in 2024 has been made possible by the recently completed consolidation of the Plutonic Gold Belt.

The estimation approach for the updated Trident MRE was primarily based on domains defined by geological, structural and mineralisation characteristics.  This differs from the previous MRE approach where the continuity and volume of estimation domains were largely subjected to pseudo economic and mining criteria at an elevated cut-off grade.  The Catalyst estimation approach has allowed the full grade-tonnage distribution of the mineralised domains, including additional lower grade material, to be incorporated into the MRE.

The Trident MRE has been undertaken with a focus on delineating areas of the MRE with Reasonable Prospects for Eventual Economic Extraction (RPEEE).  An underground Shape Optimiser (SO) evaluation has been applied to ensure that only cohesive groups of blocks that satisfy RPEEE are included in the MRE.

In July 2023, Catalyst released a Scoping Study assuming an underground development at Trident, with ore transported and processed through the Plutonic mill (see ASX announcement entitled "Trident Scoping Study demonstrates Plutonic's potential" dated 19 July 2023).  The Scoping Study utilised the previous Trident MRE (see ASX announcement entitled "Marymia Gold Project Mineral Resource – Updated" dated 22 February 2023).  Catalyst considers that the updated MRE would result in changes to the results published in the Scoping Study.  Updated results will be made available with the release of the DFS which is expected to occur in January 2024.

Following is a summary of the Trident Mineral Resource Estimate, as at 30 November 2023.

Table 3: Trident MRE

Deposit

Measured

Indicated

Inferred

Total

Tonnes
(Mt)

Grade
(g/t
Au)

Ounces

(koz)

Tonnes

(Mt)

Grade
(g/t
Au)

Ounces

(koz)

Tonnes
(Mt)

Grade
(g/t
Au)

Ounces

(koz)

Tonnes
(Mt)

Grade
(g/t
Au)

Ounces

(koz)

Total

-

-

-

1.6

5.0

257

2.6

3.0

251

4.2

3.7

508

Notes:


1.


Mineral Resource reported within Shape Optimiser (SO) shapes at 2.0g/t Au cut-off.  SO inputs include:
Mining Cost = AUD$101.33/t ore; Processing and Surface Haulage Costs = AUD$38.40/t ore; Site Administration Cost = AUD$5.58/t ore; Metallurgical Recovery = 83.5%; Royalties = 2.5%; Gold Price = AUD$2,800/oz
Minimum mining width = 2m

2.


Numbers may not add up due to rounding

Figure 1: Trident long section showing proposed development designs (CNW Group/Catalyst Metals LTD.)
Figure 2: Plutonic ore body with Mineral Resource outlines (CNW Group/Catalyst Metals LTD.)

This announcement has been approved for release by the Board of Directors of Catalyst Metals Limited.

Competent person's statement

The information in this announcement that relates to Plutonic Mineral Resources has been compiled under the supervision of Mr Michael Millad and Mr Andrew Grieve.  Mr Millad is a Director and Principal Geologist/Geostatistician at Cube Consulting Pty Ltd, and a Member of the Australian Institute of Geoscientists. Mr Grieve is a Principal Geologist at Cube Consulting Pty Ltd, and a Member of the Australian Institute of Geoscientists.  Mr Millad and Mr Grieve have sufficient experience that is relevant to the style of mineralisation and type of deposit under consideration and to the activity that was undertaken to qualify as Competent Persons, as defined in the 2012 Edition of the 'Australasian Code for Reporting of Exploration Results, Mineral Resources and Ore Reserves (The Joint Ore Reserves Committee Code – JORC 2012 Edition). Mr Millad and Mr Grieve consent to the inclusion in this report of the matters based on information in the form and context in which it appears.                       

The information in this report that relates to Ore Reserves is based on and fairly represents information and supporting documentation compiled by Cathy Barclay BEng (Mining Engineering), a Competent Person who is a Member of the Australasian Institute of Mining and Metallurgy. Cathy Barclay is a full-time employee of Catalyst Metals. She is a shareholder in Catalyst Metals and is entitled to participate in the Catalyst Performance Rights Plan. Cathy Barclay has sufficient experience that is relevant to the style of mineralisation and type of deposit under consideration and to the activity being undertaken to qualify as a Competent Person as defined in the 2012 Edition of the Australasian Code for Reporting of Exploration Results, Mineral Resources and Ore Reserves (JORC 2012). 

Cathy Barclay consents to the inclusion in the report of the matters based on her information in the form and context in which they are presented.  This Ore Reserve estimate has been compiled in accordance with the guidelines defined in the 2012 Edition of the Australasian Code for Reporting of Exploration Results, Mineral Resources and Ore Reserves (JORC 2012).

The information in this announcement that relates to Trident Mineral Resources has been compiled under the supervision of Mr Marcus Osiejak.  Mr Osiejak is a Senior Resource Geologist at Cube Consulting Pty Ltd, and a Member of the Australasian Institute of Mining and Metallurgy . Mr Osiejak has sufficient experience that is relevant to the style of mineralisation and type of deposit under consideration and to the activity that was undertaken to qualify as a Competent Persons, as defined in the 2012 Edition of the 'Australasian Code for Reporting of Exploration Results, Mineral Resources and Ore Reserves (The Joint Ore Reserves Committee Code – JORC 2012 Edition). Mr Osiejak consents to the inclusion in this report of the matters based on information in the form and context in which it appears.

JORC 2012 Mineral Resources and Reserves

Catalyst confirms that it is not aware of any new information or data that materially affects the information included in the original market announcements and that all material assumptions and technical parameters underpinning the estimates in the relevant market announcements continue to apply and have not materially changed. The Company confirms that the form and context in which the Competent Persons findings are presented have not been materially modified from the original market announcements.

ABOUT CATALYST METALS

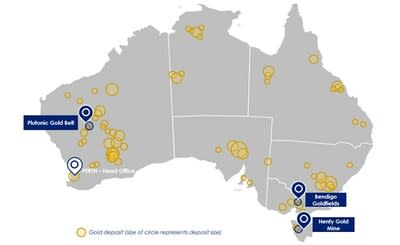
  • Catalyst Metals is an ASX listed gold producer and explorer.  Catalyst has a multi-asset strategy and controls three high grade, highly prospective and strategic gold belts in Australia:

  • In Western Australia, the Plutonic Gold Project, which holds the Plutonic Gold Mine and +40km of neighbouring, high-grade, underexplored tenements.  The project hosts a JORC Indicated Mineral Resource of 1.6Moz at 2.9g/t Au and Inferred Mineral Resources of 0.06Moz at 2.6g/t Au.

  • In Victoria, a large, contiguous and dominant Four Eagles Gold Project, covering 75 kilometres of strike length immediately north of the proven +22Moz Bendigo goldfields and near Agnico Eagle's high grade Fosterville gold mine; and

  • In Tasmania, a strategic tenement package covering 25 kilometres of the under explored Henty fault and operates the high-grade Henty Gold Mine which has produced 1.4Moz of gold at a head grade of 8.9 g/t Au.

Map (CNW Group/Catalyst Metals LTD.)

MINERAL RESOURCE ESTIMATE (Plutonic)

Cube Consulting Pty Ltd (Cube), was commissioned by Catalyst to prepare a Mineral Resource estimate (MRE) for the Plutonic Gold Mine (the Project), located in Western Australia.

Cube considered that data collection techniques are largely consistent with industry good practice and suitable for use in the preparation of a MRE to be reported in accordance with the JORC Code. Available quality control (QC) data supports use of the input data.

The Plutonic deposit comprises eight individual mine areas (Timor, Pacific, A134, Cortez, Caribbean, Caspian, Indian and Baltic).

A three-dimensional (3D) block model representing the mineralisation was created for each mine area using Leapfrog and Surpac software. Diamond core and underground face samples were used to interpolate gold grades into blocks.  The grade estimation method combines Categorical Indicator Kriging (CIK) to define broad estimation domains, together with applying distance limiting at chosen grade thresholds to restrict the influence of the high grade and extreme grade values during grade interpolation.  The block model was validated by visual checks, statistical comparisons, and swath plots to ensure that the block model was a good representation of the drillhole composite data.

The Mineral Resource is considered to have reasonable prospects for eventual economic extraction (RPEEE) given the access to critical infrastructure, the volume and grade of mineralisation available for mining and the RPEEE criteria which have been applied prior to reporting the Mineral Resource.

On Figure 1, the individual zones that comprise the Mineral Resources are presented in an isometric projection.

The following is a material information summary relating to the MRE, consistent with ASX Listing Rule 5.8.1 requirements. Further details are provided in JORC Table 1, which is included as Appendix A.

1. Geology and Geological Interpretation

The Plutonic gold deposit is located within the Archaean Plutonic Well Greenstone Belt, an elongate NE trending belt within the Marymia Inlier. The Marymia Inlier is an Archaean basement remnant within the Proterozoic Capricorn Orogen, and comprises two mineralised greenstone belts (Plutonic Well and Baumgarten greenstone belts), with surrounding granite and gneissic complexes. The Capricorn Orogen is situated between the Pilbara and Yilgarn cratons and is interpreted to be the result of the oblique collision of these two Archaean cratons in the early Proterozoic.

Gold mineralisation occurs in a large number of deposits and prospects in the Belt, with the main deposit at the Plutonic Gold Mine. Mineralisation regularly occurs as shallowly dipping, layer parallel lodes, although steep lodes and minor quartz-vein-hosted deposits also occur. Regionally within the greenstone belt, mineralised host rocks vary from amphibolites to ultramafics and banded iron formation (BIF). Lateritic and supergene enrichment are common throughout the Belt and has been mined locally. Biotite, arsenopyrite, and lesser pyrite/pyrrhotite are common minerals generally accepted to be associated with gold mineralisation.

Mineralisation at Plutonic Gold Mine is characterised by a series of steep to flat-lying, stacked replacement-style lodes, individually up to five metres wide that are hosted within ductile shear zones oriented slightly oblique to stratigraphy. Lodes are preferentially restricted within the top half of the Mine Mafic, which is a sequence of upper-greenschist to lower amphibolite grade basaltic flows of variable thickness sandwiched between the hanging wall and footwall ultramafic units. Lodes are characterised by intense banding, defined by crude mineral segregation and mineral alignment. Gold where visible, is commonly associated with grey quartz veins and fine-grained arsenopyrite and pyrrhotite.

The main style of gold mineralisation (Plutonic brown-lode) typically occurs as thin (~1 – 3 m wide) lodes that consist predominantly of quartz-biotite-amphibole-titanite-epidote-carbonate-tourmaline-arsenopyrite-pyrrhotite ± chalcopyrite ± scheelite ± gold. Visible gold is considered to have occurred at a late-stage during the evolution of the deposit as it is largely undeformed and overprints most, if not all, of the minerals and fabrics. It is typically associated with thin, discontinuous quartz-calc-silicate veins within the brown-lodes. Where these gold-bearing zones are well developed, they tend to be near-parallel to the stratigraphy as marked by the rare metasedimentary horizons and to the dominant foliation, which is also typically parallel to metasediment horizons. Geochemistry suggests that these lodes developed on the boundary between mafic units or are focused along or adjacent to minor metasedimentary units within the Mine Mafic unit. Lodes may be rich in arsenopyrite or pyrrhotite, and while arsenopyrite is a good indicator of mineralisation, it may not be present in all mineralisation.

2. Drilling Techniques

Over its 33-year production history, the Plutonic deposit has been sampled using numerous drilling and sampling techniques by Catalyst Metals Limited and previous operators.  Drilling and sampling techniques by previous operators is assumed to be to industry standard at that time.

The sampling database has been compiled from information collected when the Project was under ownership of numerous companies including (listed from most recent):

  • Catalyst Metals (2023 to current)

  • Superior Gold (2016 to 2023)

  • Northern Star (2014 to 2016)

  • Barrick Gold (2001 to 2014)

  • Homestake (1999 to 2001)

  • Resolute (1994 to 1999)

  • Battle Mountain Australia Inc. (Pre 1994)

  • Inco (1969-1971 and 1972-1976)

For Mineral Resource estimation, the Plutonic main underground area has been predominantly based on diamond drilling (DD) from surface and underground platforms and underground rock chip face samples (FS).  Reverse Circulation (RC) drilling makes up a small proportion of the data set and has been carried out at the Plutonic main deposit for delineation of open pit material.

Diamond core diameters include BQ (36.4 mm), BTW (42 mm), LTK60 (43.9 mm), NQ (47.6 mm), NQ2 (50.7 mm).  RC holes were drilled with face hammers and were sampled at one metre down hole intervals.  Face chip samples are completed by the mine geologists. The sampling is taken by chipping the face into calico bags with definition by lithological boundaries.

Underground hole collar locations are picked up regularly by site surveyors.  Multi-shot cameras are used for down-hole survey.  Face chip samples are spatially positioned within underground development voids which are picked up regularly by site surveyors.

3. Sampling and Subsampling

Exploration DD core is sawn in half along the orientation lines, with half the sample being submitted for assay and the remaining half being retained for reference.  Grade control DD core is whole core sampled and sent for analysis.  DD core samples were taken at 1 m intervals or at geological boundaries.

RC samples were collected for each metre drilled and passed through a cyclone and riffle splitter to produce a two kg to four kg assay into calico bags.

Rock chip FS are completed by the mine geologists. The sampling is taken by chipping the face into calico bags with definition by lithological boundaries.  FS samples are taken perpendicular to the lode orientation in the face.  The face sample locations are marked up and measured from fixed survey points.

DD recovery is not noted specifically, though core is locked in, and meter marked carefully. Discrepancies to core blocks are brought up with the drill contractor. Occasionally core loss blocks are inserted. Overall drill core recovery is very high due to the competent nature of the ground.

Rock chip FS recoveries are not relevant in this instance.  No RC drilling has taken place at Plutonic for several years and impact on the Mineral Resource would be minimal.

4. Sample Analysis Method

The Plutonic Gold Mine has been in operation since 1990 following discovery in 1988. QAQC procedures have changed throughout that period.  The current underground Mineral Resources have been identified over a long period of time with a number of companies.  All high confidence Mineral Resources are based dominantly on underground DD and FS completed in the last 14 years.

In recent years, for DD and FS, gold concentration is determined by fire assay using the lead collection technique with a 40gm sample charge weight.  An AAS (Plutonic site laboratory) or ICP (ALS and Bureau Veritas) finish.  A Pulverising and Leach (PAL) method was introduced to the Plutonic site laboratory in 2005.  Underground GC samples are initially assayed by PAL and where the result is greater than 0.5 g/t Au the sample is re-analysed by 40gm fire assay and the fire assay result is retained for grade estimation purposes.  It has been shown that the use of PAL assays is likely to have negligible influence on the Mineral Resource.

Sample preparation procedures for DD and FS includes:

  • 1-4 hours drying at 150°C depending on moisture content;

  • Crush 85% < 3mm – Essa jaw crusher or rotary Boyd crusher;

  • Riffle split 50:50 to<1kg;

  • Pulverise ~700-750g to 90% passing 75μm in Labtechnics LM2;

  • Scoop 250-300g.

  • Scoop to subset to 40gm for fire assay.

Quality control procedures for DD and FS includes:

  • FS – blanks added to each face sample with ore zones;

  • DD –barren wash and blanks added after each ore interval;

  • Crusher duplicates taken at 1:40;

  • Pulp duplicates taken at 1:40.

Sample preparation protocols and sample sizes are considered appropriate for the style of mineralisation encountered and should provide representative results.

Certified Reference Material (CRM's) are submitted every 20 samples for DD and once per shift for FS (approx. 1 in 15 samples).  CRM's are of similar grade tenor to those expected in the sampling. The CRM insertion rate ensures that there are at least two CRM's per assay batch.  CRM's are selected based on their grade range and mineralogical properties with an emphasis on sulphide ores.

Blanks are inserted every 20 samples for DD and for FS they are inserted after any face that contains mineralisation.

Conclusions from the MRE Competent Person include:

  • Results indicate that the QAQC performance is sufficient for using the data for an underground Mineral Resource Estimate;

  • Element of risk in using PAL due to incomplete digestion;

  • Site laboratory performance (the majority of the samples) is poorer than off-site commercial laboratories (ALS and Bureau Veritas) due to contamination and percentage of CRM failure;

  • Site laboratory shows poorer performance at low levels of Au (0.4 - 0.8 g/t), but effect on underground Mineral Resources likely to be minimal;

  • Precision of CRMs for site laboratory poorer than manufacturer.

5. Resource Estimation Methodology

Plutonic gold mineralisation is almost entirely hosted within the Mine Mafic Unit (MMA) and characterised by a significant population of high to extreme gold grades that demonstrate very poor spatial continuity (only a few meters at best).  Raw Coefficients of Variation (CoV) are typically in the order of 15-30, indicating extreme statistical variability.

The estimation method developed for the MRE combines Categorical Indicator Kriging (CIK) to define broad estimation domains, together with applying distance limiting at chosen grade thresholds to restrict the influence of the high grade and extreme grade values during grade interpolation.

Prior to estimation, a closely spaced set of structural surfaces are developed in LeapFrog reflecting the primary controls on mineralisation within the MMA.  A dip and dip-direction of each triangle facets is imported into the Surpac block model to provide information for dynamic search and variogram model orientation during grade interpolation.  Dynamic estimation is applied for estimating the CIK indicators and gold grades.

All DD and FS data are composited to 1m downhole and data within dolerite dykes or vein zones are removed.  Composited data was split into the eight mine areas.

Two Categorical Indicator values are determined for each mine area:

  • A low-grade (LG) indicator to differentiate between background 'waste' and low-tenor mineralisation – around 0.5 g/t Au.

  • A high-grade (HG) indicator to define broad areas of consistent higher-tenor mineralisation – typically between 1.1 g/t and 1.7 g/t Au.

Indicator variograms were modelled for the LG and HG thresholds for all mine areas.  The indicator variograms for both grade thresholds exhibited a moderate nugget effect and demonstrated well-structured continuity up to 30m.  The CIK indicators were estimated using Ordinary Kriging into a finely gridded block model with block dimensions of 1.25m x 1.25m x 1.25m.  The small block size for the indicator process is beneficial for creating categorical sub-domains at resolution which can be used to accurately back-flag composite data.

Three categorical sub-domains were generated for low-grade (LG), medium-grade (MG) and high-grade (HG) areas.  The HG sub-domain was based on an indicator probability threshold of 0.35 and the LG sub-domain was based on an indicator probability threshold of 0.65. The MG sub-domain is assigned to blocks that do not satisfy either the HG or LG sub-domain criteria.

The three categorical block model sub-domains (HG, MG and LG) were used to 'back-flag' the 1m composites from each mine area, thus creating a separate composite file for each sub-domain.

Standardised assay top-cuts are applied to the composite files as follows:

  • HG = 300 g/t Au

  • MG = 40 g/t Au

  • LG = 20 g/t Au

The assay top-cuts were generally above the 99th percentile of the distribution and were aimed at globally limiting extreme values only. Top-cuts are not used as the primary tool to control metal risk.  The use of grade thresholds and distance limiting is considered a more objective and influential method in controlling metal risk, while better reflecting the actual localised occurrence of discontinuous high-grade gold mineralisation.

Grade variograms were modelled for the LG, MG and HG sub-domains for all mine areas.  The HG grade variograms exhibited a very high nugget effect (75-82%) with maximum ranges of only a few meters (2.9-3.9m).  Grade variography undertaken on the HG domain confirms the extremely variable nature of Plutonic mineralisation. As expected, grade variography on the MG and LG domains resulted in lower nuggets effects and longer ranges.  Given the similarities between the spatial characteristics between all mine areas, it was decided to use an average gold grade variogram for each domain across all mine areas.

Grade thresholds for distance limiting were determined for each mine area from log-probability plots.  Initial distance limits were determined by undertaking indicator variography at each grade threshold value.  Distance limits were subsequently optimised following a detailed backward-looking mill reconciliation using mine stope voids for the period January 2023 to August 2023 (550Kt).

Prior to grade estimation, sub-domain codes from the 1.25m resolution block model are imported into a 2.5m x 2.5m x 2.5m resolution model and the proportion of LG, MG and HG is calculated for each 2.5m block.  Grade estimation for the LG, MG and HG domains was undertaken in Surpac software using Ordinary Kriging with grade threshold distance limiting.  Search routines and variogram orientations are drawn from the pre-populated dynamic search information recorded in each block.

Final block grades at a 2.5m block resolution were calculated by weighting the estimated grades for each sub-domain by the relevant domain proportion.

The parent estimation block size was 2.5m x 2.5m x 2.5m.  A minimum of 3 and maximum of 12 (1 m composite) samples per block were used.  Block discretisation was set at 3 E x 3 N x 3 RL points (per parent block).

A standardised search ellipse of 25m x 25m x 6.25m was used.  Octant restrictions were not used.

Typical data spacing varied from 3m x 3m to >40m x 40m.

The model was validated by comparing statistics of the estimated blocks against the composited sample data; visual examination of the of the block grades versus assay data in section; swath plots; and reconciliation against previous production.

Bulk density was directly assigned by oxidation type and rock type:

  • Fresh MMA and Ultramafic = 2.9 t/m3

  • Transitional MMA and Ultramafic = 2.2 t/m3

  • Oxide MMA and Ultramafic = 1.8 t/m3

  • Fresh Quartz = 2.5 t/m3

  • Transported/Laterite = 2.1 t/m3

  • Pit Backfill and Surface Dumps = 1.8 t/m3

Mining depletion to June 30th 2023 was applied to the model.  Mining depletion is represented as a 'void proportion' at a 2.5m block resolution.

6. Classification Criteria

The Mineral Resource has been classified following due consideration of all criteria contained in Section 1, Section 2 and Section 3 of JORC 2012 Table 1.

The supplied drilling database represents an appropriate record of the drilling and sampling undertaken at the project. In general drilling, surveying, sampling, analytical methods and controls are considered appropriate for the style of mineralisation under consideration.

The continuity and volume of the mineralised domains has been established by surface and underground diamond drilling, together with extensive underground development and production history.

The estimation method and the associated search and interpolation parameters used are considered appropriate for estimation of the Mineral Resources and have been calibrated to recent production reconciliation.

Cube has considered all the relevant criteria and has classified the estimated Mineral Resources as Indicated and Inferred Mineral Resource.

The portions of the MRE classified as Indicated are typically based on drill spacing less than or equal to 30 m x 30 m. This drill spacing is appropriate for defining the continuity and volume of the mineralised domains and estimating robust global Mineral Resources. Approximately 85% of the Indicated portion of the MRE has been drilled at closer then 30 m x 30 m and 70% of the Indicated portion has been drilled at better than 24 m x 24 m.

The portions of the MRE classified as Inferred typically represent peripheral areas of the deposit where geological continuity is present but not consistently confirmed by 30 m x 30 m drilling or closer.

Further considerations of resource classification include; data type and quality, geological understanding, amount of historical development and stoping, and historical and recent production reconciliation performance.

The Mineral Resource classification appropriately reflects the view of the Competent Person.

7. Reasonable Prospects for Eventual Economic Extraction

The Plutonic Gold Mine has operated continuously for 33 years.  The Mineral Resource is considered to have reasonable prospects for eventual economic extraction (RPEEE) given the access to critical infrastructure, the volume and grade of mineralisation available for mining and the RPEEE criteria which have been applied prior to reporting the Mineral Resource.

Reporting Cut-off Grades

The Plutonic underground Mineral Resources are reported at a cut-off grade of 1.5 g/t Au. The cut-off grade has been derived from current mining and processing costs and metallurgical parameters.  Inputs into the cut-off grade calculation include:

  • Incremental Stoping and Grade Control Cost = AUD$60/t

  • Processing Costs = AUD$31/t ore

  • Site Administration Cost = AUD$23/t ore

  • Metallurgical Recovery = 84%

  • Royalties = 2.5%

  • Gold Price = AUD$2,800/oz

In addition to applying a cut-off grade of 1.5 g/t Au, the Mineral Resource has been reported within an underground Shape Optimiser (SO) evaluation from the undiluted and depleted resource model.  SO input parameters include a minimum mining width of 3m, minimum stope length of 5m, stope height of 15m.

8. Mining and Metallurgical Methods and Parameters

Plutonic is an operating mine and there are no material metallurgical issues that are known to exist.

MINERAL RESOURCE ESTIMATE (Trident)

Cube Consulting Pty Ltd (Cube) was commissioned by Catalyst to prepare a Mineral Resource estimate (MRE) for the Trident Gold Deposit (the Project), located in Western Australia.

Cube considered that data collection techniques are largely consistent with industry good practice and suitable for use in the preparation of a MRE to be reported in accordance with the JORC Code. Available quality control (QC) data supports use of the input data.

The Trident deposit comprises fourteen mineralised domains that have been estimated into a single block model based on all available data at 5th September 2023.

A three-dimensional (3D) block model representing the mineralisation was created using Leapfrog and Surpac software.  Surface Diamond Drilling (DD) core and Reverse Circulation (RC) chips were used to interpolate gold grades into blocks using Ordinary Kriging.  The block model was validated by visual checks, statistical comparisons, and swath plots to ensure that the block model was a good representation of the drillhole composite data.

The Mineral Resource is considered to have reasonable prospects for eventual economic extraction (RPEEE) given the access to critical infrastructure, the volume and grade of mineralisation available for mining and the RPEEE criteria which have been applied prior to reporting the Mineral Resource.

On Figure 1, the Trident Mineral Resources are presented in an isometric projection.

The following is a material information summary relating to the MRE, consistent with ASX Listing Rule 5.8.1 requirements. Further details are provided in JORC Table 1, which is included as Appendix A.

1. Geology and Geological Interpretation

The Trident gold deposit is located within the Archaean Plutonic Well Greenstone Belt, an elongate NE trending belt within the Marymia Inlier. The Marymia Inlier is an Archaean basement remnant within the Proterozoic Capricorn Orogen, and comprises two mineralised greenstone belts (Plutonic Well and Baumgarten greenstone belts), with surrounding granite and gneissic complexes. The Capricorn Orogen is situated between the Pilbara and Yilgarn cratons and is interpreted to be the result of the oblique collision of these two Archaean cratons in the early Proterozoic.

It is a structurally controlled, orogenic, mesothermal (amphibolite metamorphic facies) gold deposit hosted by ultramafic rocks that are part of strike extensions to the Plutonic Gold Mine stratigraphy. The gold deposit is specifically hosted by shallow to moderate dipping, ultramafic tremolite – phlogopite (mica) schist, immediately overlying serpentinised ultramafic units, derived from higher MgO ultramafic volcanics.

High-grade gold zones are best developed within the shallow dipping ultramafic tremolite – phlogopite schist where it is bent into a concave flexure, in the hanging wall of steep, north-westerly dipping fault structures. Vertical "dragging" movement against these steeply dipping faults appears to have played a role in dilating the cleavage of the ultramafic schist, resulting in mineralisation and alteration between the dilated cleavage planes. The steeply dipping faults also host gold mineralisation.

Gold mineralisation is associated with potassic, phlogopite mica alteration and has a low proportion of quartz and sulphides, including minor pyrrhotite, pentlandite, chalcopyrite and, directly associated with gold, bismuthinite and rare bismuth tellurides. Rarely observed gold grains (in microscopy) are predominantly fine (<50 micron) but free and/or attached to, and rarely occluded within, sulphide grains.

2. Drilling Techniques

The sampling database for Trident includes data collected by diamond drilling (DD) and Reverse Circulation (RC) techniques. The sampling database has been compiled from information collected when the Project was under ownership of numerous companies including (listed from most recent):

  • Catalyst Metals (2022 to current)

  • Vango (2013 to 2023)

  • Dampier Gold (2012 to 2013)

  • Barrick Gold (2001 to 2012)

  • Homestake (1999 to 2001)

  • Resolute (1994 to 1999).

  • Battle Mountain Australia Inc. (Pre 1994)

  • Inco (1969-1971 and 1972-1976)

For the most recent drilling completed by Catalyst and Vango, planned drill hole collars were pegged with a DGPS and marked with wooden pegs hammered into the ground and flagged with high visibility flagging tape.

On completion of drilling, the actual drill hole collar position is measured by survey staff using a DGPS working off a network control of survey stations, to an accuracy of 20 mm from the nearest survey station. These coordinates replace the planned coordinates in the geological database. These collar co-ordinates are then uploaded to the database, where a transformation is performed on them, where the holes are rotated to populate the local grid co-ordinates (Trident Local Grid).

The survey station network meets the Mine Safety and Inspection Regulations 1995, section 3.49, where the accuracy of a survey must be not less than 1:5000.

The collar locations of historic drill holes were validated from geological logging information from annual reports and the original database when Vango acquired the tenure.

  • The majority of drill holes used in the resource estimate have been accurately surveyed by qualified surveyors using DGPS. Downhole surveys have been conducted at regular intervals using industry-standard equipment.

  • Some magnetic units have affected the azimuth readings where single shot cameras were used and these records have not been used. Many holes have been surveyed using Gyro tools.

All Vango/Catalyst holes used in the resource estimate have some form of down hole survey. Recent (2023) downhole survey data was collected by Westdrill using an Axis Mining Technology Champ North Seeking Gyro tool. Surveys are conducted at EOH using a north seeking gyroscope reading every 5 m.  If early drilling finds strong hole deviation, then surveys are conducted during drilling (collar, 30 m, 60 m, 90 m etc to EOH).  Survey deviation is supervised by the geologist onsite, with major deviation discussed with the driller at the time.

Previous downhole survey data was collected using a REFLEX gyro tool and historically with Eastman cameras, with follow-up downhole surveys carried out by Surtron using gyroscopic survey equipment. Historical downhole surveys were reviewed and verified where information was available through direct comparison within the database.

3. Sampling and Subsampling

Diamond drilling assays are from mostly half core and minor quarter core, NQ2 and HQ size core. This is considered to be sufficient material for a representative sample. Core samples were taken at 1 m intervals or at geological boundaries.

RC drilling assays are from 1 m samples split on the cyclone for the ultramafics. 4 m composites from these 1 m splits are taken in the cover sequence. Historical RC samples were collected as 4 m composite spear samples. Mineralised zones were sampled at 1 m intervals using a 1/8 riffle splitter.

Recovery in diamond drilling is based on measured core returned for each 3 m. RC drilling was bagged on 1 m intervals and an estimate of sample recovery has been made based on the size of each sample.

No assessment of RC chip sample recoveries was undertaken on historical data however a comprehensive historical review of sampling procedures was undertaken which indicates that standard procedures where enacted to ensure minimal sample loss. Where information on the recoveries has been recorded, they have been consistent with those noted by recent drilling.

4. Sample Analysis Method

Information sourced indicates that several analytical laboratories have been used over the history of the Trident Deposit, and analytical methodologies have varied slightly over time. Typically fire assay with determination by atomic absorption spectrometry (AAS) has been used. Where records have been found the assay protocols were as follows:

  • 1995: 230 RC pre-collar and 1473 core sample submitted to Minlab, Malaga for Au Fire Assay.

  • 1996: Minlab, Malaga for Au Fire Assay.

  • 1997: Minilab, Malaga RC - Aqua Regia check samples and standards, DD - Fire Assays.

  • 1998: Minilab, Malaga RC - Aqua Regia check samples and standards, DD - Fire Assays.

  • 2002: Samples were assayed for gold and arsenic at Amdel Laboratory (Perth); gold analysis was carried out using a 50 g charge fire assay with AAS finish (detection limit of 0.01 ppm).

  • 2007 to 2010: Assay sample preparation comprised the crushing of RC chips and half-core, splitting and pulverising 500 - 800 grams to 90% passing 106 µm at the Plutonic Gold Mine laboratory. A representative 30 gram charge was assayed for Au by Aqua Regia with Atomic Adsorption Spectrometer grade determination. The lower detection cut-off limit was 0.01 ppm. All samples reporting greater than 0.3 g/t and other selected samples were then forwarded to Amdel Laboratories for analysis by fire assay, using a 40 gram charge. Five percent of samples sent to Amdel were forwarded to Genalysis for further check fire assaying. Five percent of all RC samples were submitted to the PGM laboratory for check sample preparation and assaying.

  • 2012: Drill chip samples were dispatched to the Genalysis Laboratory in Perth for analytical work. The chips were subject to a SSMG grind time of four minutes and the resultant pulp was assayed to Genalysis's Fire Assay Standard FA25 AAS, RC and diamond FA25 SAA and RAB were assayed for multi elements.

Recent samples were analysed at ALS Malaga using a 50 g Fire Assay method. Samples were dried, crushed and pulverised prior to analysis.

Although sample collection, sample preparation, sample logging and analytical techniques have varied over the Project's history, all can be considered as industry standard at the time. The amount of QC data that was collected has also varied over the Project's history, but overall is considered as being acceptable to support the MRE.

Details relating to drilling techniques, quality assurance (QA) protocols and quality control (QC) results for data gathered prior to 2013 was documented and validated through an extensive WAMEX review. 1,266 historical Standards were analysed with the results showing no major issues. Overall historical blank performance was considered acceptable, with no evidence of contamination observable in the results. 100% of samples were within the pass limit (5x the detection limit)

For recent drilling, a technical summary that outlined the independent performance analysis of the (QAQC) samples routinely inserted as part of the RC and DD operations at the Trident Gold Deposit was undertaken by Cube Consulting in August 2023. 2,334 QC materials were analysed, with no issues discovered.

5. Resource Estimation Methodology

All geological domains used in the MRE were constructed by Cube using Leapfrog software. Block modelling and grade interpolation were carried out by Cube Consulting using Surpac software. Statistical analysis was carried out by Cube Consulting using Snowden Supervisor software.

All drillhole assay samples were flagged according to the geological and mineralisation envelopes. Sample populations were statistically analysed, and estimation domains defined. Assay top cuts were applied to 1 m composites prior to grade interpolation.

Quantitative kriging neighbourhood analysis was undertaken to assess the effect of changing key kriging neighbourhood parameters on block grade estimates. Kriging efficiency and slope of regression were determined for a range of block sizes, minimum/maximum samples, search dimensions and discretisation grids.

Within each domain, an Ordinary Kriging (OK) or Invese Distance Squared (ID²) estimate of gold grade was produced using the cut composite data. The ellipsoid search parameters were based on the variogram ranges, with the search ellipse dimensions similar to the variogram range, with anisotropies retained. Due to the orientation of some of the drill holes in relation to the mineralisation a maximum number of samples per drill hole was applied to a number of lodes. Hard boundaries were used for the estimate.

A minimum of 8 and maximum of 16 (1 m composite) samples per block were used for the estimation, with the minimums and maximums established through independent KNA on each major domain. Block discretisation was set at 5 E x 5 N x 3 RL points (per parent block).

Octant restrictions were not used, and estimates were into parent blocks, not sub-blocks.

Lodes estimated by OK used search ellipse rotation directions as determined by dynamic surfaces.

Subsequent search passes were applied to domains when blocks did not estimate at the first pass.

When appropriate, dynamic anisotropy was employed to ensure undulation in the mineralisation relating to the folded nature of the stratigraphy was captured by the search ellipses (i.e. rotating search ellipses).

Estimating using OK in domains with a mixed sample population can result in the higher-grade samples having a greater spatial influence than is warranted. As such, distance limiting of grades above a threshold over a certain distance was used. This resulted in the higher grades being more locally representative and not having an influence over distance.

After assay top-cutting, probability plots were reviewed to look for points of inflection in the sample data. This was used as an indicator of where the distance limiting function was applied.

Model validation was completed to check that the grade estimates within the model were an appropriate reflection of the underlying composite sample data, and to confirm that the interpolation parameters were applied as intended. Checks of the estimated block grade with the corresponding composite dataset were completed using several approaches involving both numerical and spatial aspects as follows:

  • Globally: Comparison of the mean block grade estimates to the mean of informing composite grades for both domain

  • Semi-Local: Using swath plots in Northing and RL comparing the estimates to the sample data

  • Local: Visual inspection of the estimated block grades viewed in conjunction with the sample data.

Density has been assigned to the resource using interpreted weathering surfaces determined from drill hole logging. Bulk density was coded by oxidation type:

  • Oxide = 1.8 t/m3

  • Transitional = 2.4 t/m3

  • Fresh = 2.9 t/m3

Over 200 density measurements were available for review predominantly in fresh material. Data was imported into Leapfrog software and statistics were compared for mineralised zones/waste and different lithologies.

With limited data available for oxide and transitional domains the density values have been defaulted to what had been coded previously and what was used in the nearby Marwest Pit.

6. Classification Criteria

The Mineral Resource has been classified following due consideration of all criteria contained in Section 1, Section 2 and Section 3 of JORC 2012 Table 1.

The supplied drilling database represents an appropriate record of the drilling and sampling undertaken at the project. In general drilling, surveying, sampling, analytical methods and controls are considered appropriate for the style of mineralisation under consideration.

The drill spacing is relatively consistent within the mineralised domains at nominal 20 m drill spacing on 20 m sections with some 40m and 80 m drill spacing on sections in the deeper edge margins of the deposit.

The recent drilling has generally confirmed the previously classified Indicated material.

Drill holes are routinely surveyed for down hole deviation using appropriate methodology.  Given the dimensions and general attitude of the modelled mineralisation, down hole deviation is considered a low risk of materially impacting the MRE.

The continuity and volume of the mineralised domains has been established by diamond and RC drilling to a confidence level where the grade and quantity can be reasonably assumed. The approach to defining the mineralised volume was firstly based on geological attributes, modified by applying a geological cut-off grade for each mineralised wireframe.

In general, the interpreted mineralised volumes have been extrapolated generally half the drill hole spacing beyond data limits.

The OK and ID² modelling method and the associated search and interpolation parameters used are considered appropriate for estimation of the Mineral Resources at this stage of the project evaluation. Cube have concluded the OK and ID² grade outcome is the appropriate model to report for the October 2023 MRE.  The estimate has also been compared to previous estimates.

Cube has considered all the relevant criteria and has classified the estimated Mineral Resources as Indicated and Inferred Mineral Resource.

The portions of the 2023 MRE classified as Indicated have been flagged by medium to high quality estimation parameters, an average distance to nearest sample of 25 m. The drill spacing within the Indicated portion of the resource is appropriate for defining the continuity and volume of the mineralised domains, at a nominal 20 m drill spacing on 20 m sections.

The portions of the 2023 MRE classified as Inferred represent typically minor lodes with less than three drill holes and portions of domains where geological continuity is present but not consistently confirmed by 20 m x 20 m drilling. The Inferred portions of the MRE are defined by a lower quality of estimation parameters, an average slope of regression (true to estimated block) of < 0.3 and an average distance to composites used of > 30 m.

7. Reasonable Prospects for Eventual Economic Extraction

The Mineral Resource is considered to have reasonable prospects for eventual economic extraction (RPEEE) given the access to nearby critical infrastructure, the volume and grade of mineralisation available for mining and the RPEEE criteria which have been applied prior to reporting the Mineral Resource.

8. Reporting Cut-off Grades

The Trident MRE is reported at a cut-off grade of 1.5 g/t Au. The cut-off grade has been derived from a first principals build-up of mining and processing costs and metallurgical parameters as part of the ongoing DFS.  Inputs into the cut-off grade calculation include:

  • Stoping, Grade Control and Surface Haulage Cost = AUD$73.59/t ore

  • Processing Costs = AUD$31/t ore

  • Site Administration Cost = AUD$5.58/t ore

  • Metallurgical Recovery = 83.5%

  • Royalties = 2.5%

  • Gold Price = AUD$2,800/oz

In addition to applying a cut-off grade of 1.5 g/t Au, the MRE has been reported within an underground Shape Optimiser (SO) evaluation from the undiluted resource model.  SO input parameters include a minimum mining width of 2m, minimum stope length of 2.5m, sublevel spacing of 5m.

9. Mining and Metallurgical Methods and Parameters

Mining of Trident is assumed to be by underground mining methods.  Trident ore is assumed to be transported and processed at the Plutonic processing facility. It is assumed that Trident will be an incremental ore source to a base load being processed at Plutonic.  The Plutonic plant is an established operation, historical operating costs are generally well understood and reliable.  Metallurgical testwork, commissioned by Como Engineers and conducted by ALS Metallurgy, showed that the Trident fresh ore is suitable for treatment via a typical crush, grind and leach process, with final gold recoveries of up to 90%.

Section 1 Sampling Techniques and Data
Plutonic Underground Deposit
(Criteria in this section apply to all succeeding sections.)

Criteria

Commentary

Sampling 
techniques

  • Over its 33-year production history, the Plutonic deposit has been sampled using numerous
    drilling and sampling techniques byBillabong Gold Pty Ltd (Billabong - 100% owned Catalyst
    Metals Limited) and previous operators. Drilling and sampling techniques by previous operators is
    assumed to be to industry standard at that time

  • For Mineral Resource estimation the Plutonic main underground area has been predominantly
    based on diamond drilling (DD) from surface and underground platforms and underground rock
    chip face samples (FS).  Reverse Circulation (RC) drilling makes up a small proportion of the data
    set and has been carried out at the Plutonic main deposit for delineation of open pit material

  • For DD samples, downhole depth is recorded by the drillers on core blocks after every run. This is
    checked and compared to the measurements of the core by a geologist to honour geological
    boundaries (lithology, mineral assemblage, alteration etc).  Sample lengths typically vary between
    0.3m and 1.0m

  • DD core is orientated using a Reflex ACT device and detailed structural measurements and
    logging is carried out. Exploration DD core is sawn in half along the orientation lines, with half the
    sample being submitted for assay and the remaining half being retained for reference. Grade
    control DD core is whole core sampled and sent for analysis

  • RC samples were collected for each metre drilled and passed through a cyclone and riffle splitter
    to produce a two kg to four kg assay into calico bags

  • FS samples are completed by the mine geologists. The sampling is taken by chipping the face into
    calico bags with definition by lithological boundaries. FS samples are taken perpendicular to the
    lode orientation in the face.  The face sample locations are marked up and measured from fixed
    survey points


Drilling 
techniques

  • Diamond core diameters include BQ (36.4 mm), BTW (42 mm), LTK60 (43.9 mm), NQ (47.6 mm),
    NQ2 (50.7 mm)

  • RC holes were drilled with face hammers and were sampled at one metre down hole intervals


Drill sample 
recovery

  • DD recovery is not noted specifically, though core is locked in and meter marked carefully.
    Discrepancies to core blocks are brought up with the drill contractor. Occasionally core loss
    blocks are inserted. Overall drill core recovery is very good

  • Billabong diamond drilling practice results in high core recovery due to the competent nature of
    the ground

  • Chip sample recoveries are not relevant in this instance. No RC drilling has taken place for a
    number of years at Plutonic and impact on the resource would be minimal

  • RC and DD by previous operators is assumed to be to industry standard at that time

  • There is no known relationship between sample recovery and grade; diamond drill sample
    recovery is very high


Logging

  • DD core, RC samples and FS chip samples have been logged by qualified geologists to a level of
    detail to support appropriate Mineral Resource estimation, mining studies and metallurgical
    studies

  • Logging and face mapping is qualitative and quantitative. Visual estimates of sulphide (percentage)
    and alteration (intensity scale) are recorded. Core Logging and face mapping notes lithology,
    alteration, mineralisation and structures. Structural readings are taken at relevant structures and
    where the foliation is relatively consistent

  • All DD core is digitally photographed and logged.  Faces are mapped and sampled when access
    permits


Sub-sampling 
techniques and
sample
preparation

  • If the DD core was BQ, LTK48 orBTW it was sampled as full core and dispatched to the laboratory
    for analysis. Most LTK60 and NQ2 DD core is cut in half with anAlmonté diamond core saw; the
    top half of the core was sent to the laboratory for analysis and the other half was placed back in
    the core tray, transferred onto pallets, and moved to the core yard library. AllGC drilling, regardless
    of core size, is whole core sampled

  • RC samples were collected for each metre drilled and passed through a cyclone and riffle splitter
    to produce a two kg to four kg assay into calico bags. Depending on the oxidation state of the rock,
    the sample weight varied between three and five kilograms. A duplicate sample was also collected
    and retained in a temporary sample storage facility for further check sampling.  The RC drilling and
    sampling were supervised at the drill site by a company sampler and geologist. The riffle splitter was
    cleaned using compressed air after every sample and the cyclone was cleaned every 40m, or
    more regularly at the geologists' discretion.  Wet or damp RC samples were allowed to dry before
    riffle splitting

  • FS chip samples are taken by chipping the face into calico bags with definition by lithological
    boundaries

  • Sample preparation procedures for DD and FS includes:

    • 1-4 hours drying at 150°C depending on moisture content;

    • Crush 85% < 3mm – Essa jaw crusher or rotary Boyd crusher;

    • Riffle split 50:50 to<1kg;

    • Pulverise ~700-750g to 90% passing 75μm in Labtechnics LM2;

    • Scoop 250-300g;

    • Scoop to subset to 40gm for fire assay

  • Quality control procedures for DD and FS includes:

    • FS – blanks added to each face sample with ore zones;

    • DD –barren wash and blanks added after each ore interval;

    • Crusher duplicates taken at 1:40;

    • Pulp duplicates taken at 1:40

  • Sample preparation protocols and sample sizes are considered appropriate for the style of
    mineralisation encountered and should provide representative results


Quality of assay 
data and
laboratory tests

  • The Plutonic Gold Mine has been in operation since 1990 following discovery in 1988. QAQC
    procedures have changed throughout that period. The current underground Mineral Resources
    have been identified over a long period of time with a number of companies.  All high confidence
    Mineral Resources are based dominantly on underground DD and FS completed in the last 14 years

  • In recent years, for DD and FS, gold concentration is determined by fire assay using the lead
    collection technique with a 40gm sample charge weight.  An AAS (Plutonic lab) or ICP (ALS and
    Bureau Veritas) finish

  • A Pulverising and Leach (PAL) method was introduced to the Plutonic site laboratory in 2005. 
    Underground GC samples are initially assayed by PAL and where the result is greater than 0.5 g/t
    Au the sample is re-analysed by 40gm fire assay and the fire assay result is retained for grade
    estimation purposes.  It has been shown that the use of PAL assays is likely to have negligible
    influence on the Sept 2023 MRE

  • Although PAL is not considered to be a total gold analysis, the larger sample size still produces a
    representative result.  Fire assay gold analysis is considered to be total gold

  • Samples are dried, crushed and pulverised prior to analysis

  • Certified Reference Material (CRM's) are submitted every 20 samples for DD and once per shift for
    FS (approx. 1 in 15 samples).  CRM's are of similar grade tenor to those expected in the sampling.
    The CRM insertion rate ensures that there are at least two CRM's per assay batch.  CRM's are
    selected based on their grade range and mineralogical properties with an emphasis on sulphide
    ores

  • Blanks are inserted every 20 samples for DD and for FS they are inserted after any face that contains
    mineralisation

  • Grind checks or sizing was carried out on a frequency of 1 in 40 on both pulp residues and crush
    residues prior to January 2020. Since January 2020, crush sizing analysis is conducted randomly.
    The data is collected throughout the shift with results calculated at the end of shift. Pulp residues
    are expected to have 90% passing ≤75μm. The crush residue is expected to have 80% passing ≤3
    mm. This data is monitored by the Laboratory Supervisor. Grind times can be lengthened
    accordingly

  • Field, crush and pulp duplicates, occur at a frequency of 2.5%

  • Current procedures dictate a process of validation and checking of laboratory results when data is
    returned by the laboratory as it is loaded into the acQuire database. A standard set of plots and
    checks are undertaken, and if results fall outside of the expected limits, then re-assaying is
    requested. Monthly QAQC reports are generated by the database administrator and documented
    from automated routines out of the database

  • A comprehensive review of QAQC results was carried out for the CIM NI 43-101 report relating to
    the 2022 Mineral Resource and Reserve Estimate for the Plutonic Estimate (2022 MRE – Effective
    Date December 31, 2021)

  • Conclusions from the 2022 MRE Qualified Person include:

    • Overall performance of the Plutonic site and external laboratory (ALS) are adequate for
      estimating and reporting Mineral Resources for the Plutonic underground operations
      despite some minor shortcomings in the site laboratory;

    • The accuracy of the laboratories is within 3% error;

    • The variance of the laboratories (precision) based on CRM's is acceptable for
      underground production purposes;

    • Both ALS and Plutonic laboratories performed well on precision and accuracy with ALS
      lab slightly better precision;

    • Coarse duplicates revealed relative errors at 20% for samples with Au >7 g/t and 30%
      relative errors for samples with Au between 3 and 7 g/t;

    • 50% of the errors of the coarse duplicates may have been caused by a coarse gold nugget
      effect. The remaining errors were likely caused by contamination, other laboratory
      procedure breaches and human error

At the Plutonic Laboratory there was:

    • some low-level contamination at crushing stage;

    • some minor procedural non-compliance at crushing, pulverising, and instrument
      assaying stage;

    • periodic increased assaying uncertainty may be caused by possible human errors;

    • the extent of the laboratory contamination is unknown given the random nature of the
      blank insertion;

    • upper limit for blanks of 0.2 g/t is too high to effectively detect contamination

At ALS Laboratory there was:

    • there was insignificant contamination at the lab during the period;

    • the laboratory has performed consistently well;

    • laboratory precision test on CRM's indicated a better performance than CRM manufacturer

  • DD and FS data collected since the 2022 MRE consists almost entirely of additional grade control
    data and represents a relatively small proportion of the total dataset used for the JORC June 30,
    2023 Mineral Resource Estimate (Sept 2023 MRE)

  • Conclusions from the Sept 2023 MRE Competent Person include:

    • Results indicate that the QAQC performance is sufficient for using the data for an
      underground Mineral Resource Estimate;

    • Element of risk in using PAL due to incomplete digestion;

    • Site laboratory performance (the majority of the samples) is poorer than off-site labs (ALS
      and Bureau Veritas) – contamination and percentage of CRM failure;

    • Site laboratory shows poorer performance at low levels of Au (0.4 - 0.8 g/t), but effect
      on underground Mineral Resources likely to be minimal;

    • Precision of CRMs for site laboratory poorer than manufacturer

Verification of 
sampling and
assaying

  • DD and face logging is completed electronically onto laptops. Database protocols and rules
    are applied upon data entry

  • Visual validation and check logging of face and drill data

  • Drill data is stored in an AcQuire database, face data in an Acquire. All maintained full-time
    Database Administrator

  • All face and drill data within site databases are regularly validated using both internal database
    systems and external validation tools

  • Validation of pre-Billabong data is completed periodically

  • There is no requirement for twinned holes in a production setting

  • Conversion of lab non-numeric codes to numeric for estimation


Location of data 
points

  • UG hole collar locations are picked up regularly by site surveyors

  • Multi shot cameras are used for down-hole survey

  • Development faces are spatially located using MineMapper and Vulcan 3D software

  • Underground development voids are picked up regularly by site surveyors. Stopes voids are
    generally all surveyed by CMS (where practical and safe to do so)


Data spacing 
and distribution

  • Plutonic underground Mineral Resources are primarily based on DD and FS data

  • Given the high degree of grade variability and spatial complexity at the Plutonic underground mine
    (extremely high nugget effect and minimal short-scale spatial continuity), it is difficult to generate
    local scale grade estimates that would adequately satisfy a Measured Resource classification.For
    this reason, no Measured material has been included in the Sept 2023 MRE.Indicated Resources
    can be reasonably well-defined with DD spacing up to 30m × 30m.  Average data spacing for
    Indicated resources for the Sept 2023 MRE is approximately 20m× 20m.  Inferred resources are
    assigned to areas where DD spacing is generally greater than 30m × 30m

  • Grade control DD spacing typically required for stope definition is between 8m × 8m to 10m ×10m.
    Close spaced FS are also used for stope definition

  • The data spacing and distribution is sufficient to establish geological and/or grade continuity
    appropriate for the Mineral Resource and classifications to be applied, with known likelihood of
    local variability

  • The drill core is logged and divided into sample intervals that have a minimum sample length of
    0.3m and a maximum sample length of 1.0m. Intervals should honour geological boundaries such
    as faults and lithological contacts. Most nominal sample lengths were at 1m intervals; sample
    compositing is not applied until the estimation stage

  • Compositing of the data to 1m was used in the estimate

  • No recent RC drilling has been undertaken


Orientation of 
data in relation
to geological
structure

  • Drilling is orientated as close to perpendicular to mineralisation where possible. However,
    orientation to lode may be compromised by access to suitable drill platforms. Drillholes are
    extended to Mine Mafic boundary where required and practicable

  • Face sampling is orientated perpendicular to lode orientation

  • The variable drill orientation relative to mineralisation is not thought to make a material difference
    in the resource estimation


Sample security

  • All cut drill core is kept in an unfenced core farm adjacent to the core cutting and processing shed.
    This is not regarded as a security risk due to the remote location of the mine with no community
    development near the mine. All core is photographed and records kept electronically

  • Geologists are responsible for marking the sample intervals and placement of Blanks and Standards
    within the sampling stream for both faces and core. The Project Geologist and Senior Geologist
    complete quality control checks on the face data daily

  • Field Staff are primarily responsible for the collection of samples from the face as chips, as well as the cutting and sampling of core. Also generating the sample numbers for core submission, creating a sample submission sheet for core and faces, randomly selecting and recording the standards to be sent to the laboratory and the transportation of the samples to the laboratory

  • Once a hole has been sampled, the sample calculation and check geology documents are handed to the Database Administrator (DBA) who converts the digital copy of the sample calculation to a .csv file which is then imported into the AcQuire database

  • Upon receiving the digital file for the assay data, the DBAs import the file into the master AcQuire database. This data is not accessible for assessment until it has been validated as complete and correct by the QAQC Geologist and DBA. Face data is received in the same format and is entered into the AcQuire database

  • Pulp rejects from assayed samples are kept in wooden boxes on top of the waste dump. These are visited frequently as samples are taken for research and other purposes

  • Drill logs are kept in hard copy and electronically and are available for checking and due-diligence


Audits or reviews

  • A review by Jacqui Coombes (Coombes, 2009) concluded that it was reasonable to combine the drillhole and face sampling data for the Plutonic deposit – report sighted

  • A previous review by Roscoe Postle and Associates (RPA) in 2012 concluded that the data verification systems were adequate for Mineral Resource estimation

  • Previous estimation process review by Optiro (2015) identified that reduced manning levels were having an impact on the quantity and quality of the data being generated in 2015, however, overall, the data collection systems which support the Mineral Resource estimation process were found to be best practice – report unsighted

  • In 2022, SnowdenOptiro completed a technical review of the 2022 Mineral Resource Estimate prior to a public release. This report indicated some concerns about smearing of high grades into low grade areas, the assignment of Measured and Indicated resources in areas of low data density and the lack of a reconciliation analysis against the estimate

  • No external audits or reviews have been undertaken on the Sept 2023 Mineral Resource Estimate


Section 2 Reporting of Exploration Results
Plutonic Underground Deposit
(Criteria listed in the preceding section also apply to this section.)

Criteria

Commentary

Mineral 
tenement and
land tenure
status

  • The Plutonic Gold Mine group includes 30 granted exploration and mining tenements (24 mining leases, 2 exploration licences, and 4 prospecting licences) (as such term is defined in the (Western Australian) Mining Act 1978 (the "Mining Act"))

  • All rents to Department of Mines, Industry Regulation and Safety ("DMIRS") have been paid and made within one month after the anniversary commencement date of the tenement as allowed under the Mining Act.

  • All tenement Shire rates have either been paid or will be paid within the required timeframes.

  • All compliance reporting including Form 5 Reports, have been lodged within the timeframes allowed under the Mining Act 1978 as amended.

  • All Geological Reports have been lodged.

  • There are no other unexpected encumbrances registered or recorded against the tenements.

  • There are no Forfeiture proceedings against any tenements.


Exploration done 
by other parties

  • 1969-1976 – International Nickel Company (Inco) conducted nickel exploration using geochemistry, geophysics, costeaning, RAB and RC drilling.

  • 1987 – Great Central Mines (GCM) identified an arsenic and gold anomaly by geochemical sampling in the Plutonic tenements.

  • 1987-1993 – Battle Mountain Australia (BMA) undertook regional mapping, Bulk Leach Extractable Gold (BLEG) soil sampling, and RAB drilling. The Triple P, Pelican, Albatross and Flamingo deposits were discovered in 1992. Further RAB, AC, RC and DD programs were conducted to define these deposits.

  • 1988-1994 - Resolute Resources Ltd (75%) and Titan Resources NL (25%) commenced exploration on the Marymia tenements. Gold mineralisation was discovered in the Keillor Shear Zone following regional exploration soil, stream sediment and rock chip sampling and geological mapping. Several phases of follow-up RAB, AC, RC and DD drilling was carried out. K1 deposit was discovered in 1989. Prospect scale geophysical surveys including magnetics and gradient array IP were undertaken between 1989 and 1994.

  • 1990 – GCM carried follow up grid-based mapping, soil and lag geochemical surveys which led to the discovery of the Plutonic deposit.

  • 1990 – GCM discovered satellite deposits at Area4 and Channel. Both were mined by open pit between 1999 and 2001.

  • 1990-1995 – Plutonic Resources exploration division carried out exploration on the Freshwater tenements and discovered a total of 1 underground and 30 surface prospects. Follow up resource definition drilling resulted in conversion of these prospects to 10 open pits and one underground mine, including Area 4 open pit, Plutonic East underground deposit, Salmon, Trout and Perch.

  • 1999-2004 - Homestake Gold of Australia undertook a detailed aeromagnetic and radiometric survey over the entire lease area. Additional IP and moving loop geophysical surveys were undertaken between 2000 and 2004 across several prospects. The largest of which was across the K1-K2 project area in 2004.

  • 2004 - the Plutonic Development department undertook a large soil sampling programme over the northwestern end of the Marymia tenements, in conjunction with the IP survey. These surveys identified a number of targets that were followed up with some additional surface geochemical sampling.

  • 2001-2007 - exploration and resource definition drilling by RAB, RC and diamond core drilling was undertaken by the Plutonic Development department across numerous prospects outside of the Plutonic Mine area. Many of these drilled prospects were proven up to become small satellite open pit mines such as Triple P B-Zone, Albatross, Flamingo, Kookaburra, Ibis, Piranha, to name a few.

  • 2009-2012 - RC and diamond core drilling concentrated on extensions to the known Plutonic deposit. Outside of this area two 2D seismic lines were shot in conjunction with Curtin University and diamond core drill was undertaken at Plutonic West and Cod prospects.


Geology

  • The gold deposits at Plutonic are hosted by an Archaean greenstone sequence and occur mainly as a multiple lode system with variable dip (horizontal to vertical) hosted almost exclusively by a mafic amphibolite sequence that is referred to as the 'Mine Mafic'.

  • Mineralisation regularly occurs as shallowly dipping, layer parallel lodes, although steep lodes and minor quartz-vein hosted deposits also occur. Mineralisation at Plutonic is characterized by a series of moderately-dipping to very flat-lying, stacked replacement-style lodes, individually up to five metres wide, that are hosted within ductile shear zones, oriented slightly oblique to stratigraphy.


Drill hole 
Information

  • No exploration has been reported in this release, therefore there are no drill hole intercepts to report. This section is not relevant to this report on Mineral Resource and ore Reserves.


Data 
aggregation
methods

  • No exploration has been reported in this release, therefore there are no drill hole intercepts to report. This section is not relevant to this report on Mineral Resource and ore Reserves.


Relationship 
between mineralisation
widths and intercept lengths

  • No exploration has been reported in this release, therefore there are no drill hole intercepts to report. This section is not relevant to this report on Mineral Resource and ore Reserves.


Diagrams

  • No exploration has been reported in this release, therefore there are no drill hole intercepts to report. This section is not relevant to this report on Mineral Resource and ore Reserves.


Balanced reporting

  • No exploration has been reported in this release, therefore there are no drill hole intercepts to report. This section is not relevant to this report on Mineral Resource and ore Reserves.


Other 
substantive exploration data

  • No exploration has been reported in this release, therefore there are no drill hole intercepts to report. This section is not relevant to this report on Mineral Resource and ore Reserves.


Further work

  • Underground grade control and extensional drilling programs are underway, and will continue in line with mine development and production requirements.


Section 3 Estimation and Reporting of Mineral Resources
Plutonic Underground Deposit
(Criteria listed in section 1, and where relevant in section 2, also apply to this section.)

Criteria

Commentary

Database integrity

  • The Plutonic Mineral Resource database is regularly validated by Billabong staff using data validation modules of Vulcan, Leapfrog and AcQuire software programs to identify any inconsistencies or logical errors in the data. Mine staff also visually check the drill hole data on-screen on a regular basis.

  • Surface and underground drill hole and face data is validated to produce a digital database free of detected errors. This is undertaken by passing data through embedded macros and queries of the drill hole database software by table (collar, assay, lithology, survey, and grout).

  • Crosschecks are also undertaken to ensure that each drill hole has data from collar, assays, lithology, survey, and grout files. By undertaking the above procedures, all drill hole and face data is rigorously checked, verified, and corrected where necessary to ensure limited failures.

Surface and underground drill hole and face data is validated to produce a digital database free of detected errors. This is undertaken by passing data through embedded macros and queries of the drill hole database software by table (collar, assay, lithology, survey, and grout). 

Crosschecks are also undertaken to ensure that each drill hole has data from collar, assays, lithology, survey, and grout files. By undertaking the above procedures, all drill hole and face data is rigorously checked, verified, and corrected where necessary to ensure limited failures.


 Site visits

  • The Competent Persons have not undertaken a site visit at the time of this release. A site visit is planned in the near future.


Geological interpretation

  • The confidence in the geological interpretation is high with all the information and over 30 years of open pit and underground operation used in the generation of the models.

  • All available geological data was used in the interpretation, including drilling and mapping (~29,000 drillholes and ~120,000 faces).

  • The modelling approach takes advantage of many thousands of structural measurements from orientated diamond holes and underground development faces to build structural trend surfaces, and uses these trend surfaces to determine the mineralisation trend in domaining and grade estimation.

  • Mineralisation regularly occurs as shallowly dipping, layer parallel lodes, although steep lodes and minor quartz-vein hosted deposits also occur. Plutonic style mineralisation is characterised by a significant population of high to extreme gold grades that demonstrate very poor spatial continuity (only a few meters at best). These high-grade populations tend to occur in 'clusters' or cohesive zones on a large scale, however, the actual spatial continuity is very poor at a local scale, making it difficult to define robust zones of continuity without introducing significant bias.


Dimensions

  • Mineralisation extents:

  • Strike length = 3,200m (North – South)

  • Width = 2,200m (East-West)

  • Depth = Surface to 400mRL (~1,100m below surface)

  • The Plutonic mine is sub-divided into eight mine areas corresponding to historical resource zones:

  • Timor

  • Pacific

  • A134

  • Cortez

  • Baltic

  • Caribbean

  • Indian

  • Caspian


Estimation and modelling techniques

  • Plutonic gold mineralisation is almost entirely hosted within the Mine Mafic Unit (MMA) and characterised by a significant population of high to extreme gold grades that demonstrate very poor spatial continuity (only a few meters at best). Raw Coefficients of Variation (CoV) are typically in the order of 15-30, indicating extreme statistical variability.

  • The extreme grade variability and lack of spatial continuity of high grades requires a non-linear approach to deal with these high grades during estimation. A traditional approach of physical domaining, assay cutting, and linear estimation (IDW or OK) is considered inadequate in dealing with this complexity.

  • The estimation method developed for the Sept 2023 MRE combines Categorical Indicator Kriging (CIK) to define broad estimation domains, together with applying distance limiting at chosen grade thresholds to restrict the influence of the high grade and extreme grade values during grade interpolation.

  • Prior to estimation, a closely spaced set of structural surfaces are developed in LeapFrog reflecting the primary controls on mineralisation within the MMA. A dip and dip-direction of each triangle facets is imported into the Surpac block model to provide information for dynamic search and variogram model orientation during interpolation. Dynamic estimation is applied for estimating the CIK indicators and gold grades.

  • All DD and FS data was composited to 1m downhole and data within dolerite dykes or vein zones were removed. Composited data was split into the eight mine areas.

  • Two Categorical Indicator values are determined for each mine area:

  • A low-grade (LG) indicator to differentiate between background 'waste' and low-tenor mineralisation – around 0.5 g/t Au.

  • A high-grade (HG) indicator to define broad areas of consistent higher-tenor mineralisation – typically between 1.1 g/t and 1.7 g/t Au.

  • Indicator variograms were modelled for the LG and HG thresholds for all mine areas. The indicator variograms for both grade thresholds exhibited a moderate nugget effect and demonstrated well-structured continuity up to 30m. The CIK indicators were estimated using Ordinary Kriging into a finely gridded block model with block dimensions of 1.25m x 1.25m x 1.25m. The small block size for the indicator process is beneficial for creating categorical sub-domains at resolution which can be used to accurately back-flag composite data.

  • Three categorical sub-domains were generated for low-grade (LG), medium-grade (MG) and high-grade (HG) areas. The HG sub-domain was based on an indicator probability threshold of 0.35 and the LG sub-domain was based on an indicator probability threshold of 0.65. The MG sub-domain is assigned to blocks that do not satisfy either the HG or LG sub-domain criteria.

  • It is well-known that Plutonic mineralisation is characterised by a significant population of high to extreme gold grades that demonstrate very poor spatial continuity (only a few meters at best). All mine areas exhibit the presence of a high-grade population beginning at around 7-10 g/t Au. This high-grade population typically occurs around the 95-98th percentile of the distribution within the host Mine Mafic Unit (MMA). A further 'extreme' grade population is often evident at between 30-100 g/t Au depending on the mine area. This 'extreme' grade population is typically above the 99th percentile of the distribution. Whilst the 7-10 g/t Au population tends to occur in 'clusters' or cohesive zones on a large scale, the actual spatial continuity is very poor at a local scale, making it difficult to define robust zones of continuity without introducing significant continuity bias. Previous attempts to create hard domains of continuity at a 10 g/t Au cut-off often resulted in overstating the volume, grade, and continuity of these zones. The 'extreme' grade population noted above, often appears very clear on a log-probability plot, however, there is almost no cohesive spatial continuity of these grades.

  • The three categorical block model sub-domains (HG, MG and LG) were used to 'back-flag' the 1m composites from each mine area, thus creating a separate composite file for each sub-domain.

  • Standardised assay top-cuts are applied to the composite files as follows:

  • HG = 300 g/t Au

  • MG = 40 g/t Au

  • LG = 20 g/t Au

  • The assay top-cuts were generally above the 99.9th percentile of the distribution and were aimed at globally limiting extreme values only. Top-cuts are not used as the primary tool to control metal risk. The use of grade thresholds and distance limiting is considered a more objective and influential method in controlling metal risk, while better reflecting the actual localised occurrence of discontinuous high-grade gold mineralisation.

  • Grade variograms were modelled for the LG, MG and HG sub-domains for all mine areas. The HG grade variograms exhibited a very high nugget effect (75-82%) with maximum ranges of only a few meters (2.9-3.9m). Grade variography undertaken on the HG domain confirms the extremely variable nature of Plutonic mineralisation. As expected, grade variography on the MG and LG domains resulted in lower nuggets effects and longer ranges. Given the similarities between the spatial characteristics between all mine areas, it was decided to use an average gold grade variogram for each domain across all mine areas.

  • Grade thresholds for distance limiting were determined for each mine area from log-probability plots. Initial distance limits were determined by undertaking indicator variography at each grade threshold value. Indicator variography was restricted to areas of high data density and similar orientation to maximise clarity of continuity. The grade thresholds and distance limits are shown in the table below:

  • Prior to grade estimation, sub-domain codes from the 1.25m resolution block model are imported into a 2.5m x 2.5m x 2.5m resolution model and the proportion of LG, MG and HG is calculated for each 2.5m block.

  • Grade estimation for the LG, MG and HG domains was undertaken in Surpac software using Ordinary Kriging with grade threshold distance limiting.  Initial grade thresholds and distance limits were applied using the parameters defined in the table above.  Search routines and variogram orientations are drawn from the pre-populated dynamic search information recorded in each block.

  • Final block grades at a 2.5m block resolution were calculated by weighting the estimated grades for each sub-domain by the relevant domain proportion.

  • The parent estimation block size was 2.5m x 2.5m x 2.5m.  A minimum of 3 and maximum of 12 (1 m composite) samples per block were used.  Block discretisation was set at 3 E x 3 N x 3 RL points (per parent block).

  • A standardised search ellipse of 25m x 25m x 6.25m was used.  Octant restrictions were not used.

  • Data spacing varied from 3m x 3m to >40m x 40m.

  • The entire Plutonic model was estimated based on the 'Initial' Distance 1 limits as shown in the table above.  A backward-looking mill reconciliation was carried out using mine CMS stope voids for the period Jan to August 2023 (550Kt). The initial distance limits resulted in a 15% under-call compared to the mill reconciliation for the period.  The Distance 1 limits were therefore modified and the model was re-run.  The final grade threshold and distance limits shown in the table below resulted in the final Sept 2023 MRE being within 4.1% (above) of mill reconciliation. Given there is always a small amount of additional operational metal loss between in-situ CMS model reports and actual production, the actual reconciliation between the Sept 2023 MRE and Mill is likely to be slightly better than within 4.1%.

  • No deleterious elements were estimated or assumed.

  • No selective mining units were assumed in the resource estimate.

  • Only gold grade was estimated.

  • The model was validated by comparing statistics of the estimated blocks against the composited sample data; visual examination of the of the block grades versus assay data in section; swath plots; and reconciliation against previous production.


Area

Threshold 1
(Au/gt)

Initial
Distance 1
(m)

Final
Distance 1 
(m)

Threshold 2
(Au/gt) 

Final
Distance 2 
(m)

A134

5

7

10

100

4

Baltic

10

8

10

100

5

Caribbean

7

7.5

10

90

6

Caspian

7

7

10

50

5

Cortez

8

7

10

40

4

Indian

7

4.5

10

50

4

Pacific

10

11

10

30

8.7

Timor

10

9

10

100

6.25

Grade Thresholds and Distance Limits


Criteria

Commentary

Moisture

  • All estimations were carried out on a 'dry' basis.


Cut-off parameters

  • Plutonic underground Mineral Resources are reported at a cut-off grade of 1.5 g/t Au. The cut-off grade has been derived from current mining and processing costs and metallurgical parameters.

  • Inputs into the cut-off grade calculation include:

Incremental Stoping and Grade Control Cost = AUD$60/t

Processing Costs = AUD$31/t ore

Site Administration Cost = AUD$23/t ore

Metallurgical Recovery = 84%

Royalties = 2.5%

Gold Price = AUD$2,800/oz

Mining factors or assumptions

  • The Plutonic underground Mineral Resource estimate is reported within an underground  Shape Optimiser (SO) evaluation from the undiluted and depleted resource model.  SO input parameters include a 1.5 g/t Au cut-off, minimum mining width of 3m, minimum stope length of 5m, stope height of 15m and a gold price of AUD$2,800/oz.

  • The orientation of SO's is variable depending on the geometry of the mineralisation.


Metallurgical factors or assumptions

  • It is assumed the material will be processed at the Plutonic Gold Plant. Recovery factors are assigned based on-going experience.

  • No metallurgical modifying factors or assumptions have been built or applied to the resource model.


Environmental factors or assumptions

  • The Plutonic underground operation is a going concern and as such previous practices have proven to be effective and practical.

  • A conventional storage facility is used for the process plant tailings.

  • The small amount of waste rock is stored in a traditional waste rock landform 'waste dump'. Due to low sulphide content and the presence of carbonate alteration the potential for acid drainage formation is considered to be low.


Bulk density

  • Bulk density is determined from drill core using a weight in air/weight in water method.  Currently there is a database of over 3,800 bulk density measurements which have been taken from mineralised and unmineralised intervals, with an ongoing sampling program in place.

  • Samples of between 0.5 and 2.0kg are weighed in air and weighed in water. The following equation is used to derive bulk density Bulk Density = 𝑊𝑑 / (𝑊𝑑𝑊𝑤).

  • Bulk density was directly assigned by oxidation type and rock type:

MMA/Mafic/Ultramafic/Dolerite

Fresh = 2.9 t/m3

Transitional = 2.2 t/m3

Oxide = 1.8 t/m3

Fresh Quartz = 2.5 t/m3

Transported/Laterite = 2.1 t/m3

Pit Backfill and Surface Dumps = 1.8 t/m3

Classification

  • Factors considered when classifying the model include:

    • The portions of the 2023 MRE classified as Indicated are typically based on drill spacing less than or equal to 30 m x 30m. This drill spacing is appropriate for defining the continuity and volume of the mineralised domains and estimating robust global Mineral Resources. Approximately 85% of the Indicated portion of the Sept 2023 MRE has been drilled at closer then 30m x 30m and 70% of the Indicated portion has been drilled at better than 24m x 24m.

    • The portions of the Sept 2023 MRE classified as Inferred typically represent peripheral areas of the deposit where geological continuity is present but not consistently confirmed by 30 m x 30 m drilling or closer. 

    • Further considerations of resource classification include; data type and quality, geological understanding, amount of historical development and stoping, and historical and recent production reconciliation performance.

    • The Mineral Resource classification appropriately reflects the view of the Competent Person.


Audits or reviews

  • The geological interpretation, estimation parameters and validation of the resource model was peer reviewed by Catalyst staff.

  • No external reviews of the resource estimate had been carried out at the time of writing.


Discussion of relative accuracy/ confidence

  • The relative accuracy of the Mineral Resource estimate is reflected in the reporting of the Mineral Resource as per the guidelines of the 2012 JORC Code.

  • The statement relates to the global estimates of tonnes and grade.

  • The estimation method adopted for the Sept 2023 MRE is believed to be appropriate for dealing with the high-degree of grade variability at Plutonic.

  • The estimated uncertainty for an Indicated Mineral Resource is typically +/- 20% over an annual production period.

  • In most cases it is considered that only development/face sampling in conjunction with <10m x 10m drill spacing is sufficient to attain enough confidence for stoping.


Section 4 Estimation and Reporting of Ore Reserves
Plutonic Underground Deposit
(Criteria listed in section 1, and where relevant in sections 2 and 3, also apply to this section.)

Criteria

Commentary

Mineral Resource estimate for conversion to Ore Reserves


  • The Mineral Resource Estimate (MRE) used for the plutonic Ore Reserve is the estimate described in section 3.

  • The Measured and Indicated Mineral Resource are reported inclusive of Ore Reserve. The Ore Reserves are a subset of the MRE, and are spatially contained within the MRE


Site visits

The Competent person is a full-time employee who has visited the site on a regular basis for the past 12 months, and has detailed knowledge of the mining methods, costs, schedule and other material parameters relating to the Ore Reserves estimate.

Study status

  • The Ore Reserves have been determined based on the current operational practises of the Plutonic operating underground mine. Plutonic has been in production as an underground operation since 1995.

  • The Ore Reserves were estimated using Deswik software (V2023.1) and reported against the updated MRE block model. Modifying factors were applied, and optimised Stope shapes were generated. All physicals were economically evaluated on a stope by stope basis and the total Ore Reserve was evaluated to assess its economic viability.

  • Previous operational performance has demonstrated that the current mining methods are technically achievable and is economically viable. The modifying factors used in the Ore Reserves calculations are based on historically achieved mining dilution and recovery factors. The current mine plan ethos and mining method used currently will continue for future mining.

  • The conversion from Resource to Reserve estimate is 30%. It is expected with further detailed mine planning and infill drilling that Resource will be converted into Reserves.


Cut-off parameters

  • The cut-off grade applied to the Ore Reserve estimate is defined as the $A value per tonne of ore after consideration of all costs (mining, processing, general and administration), metallurgical recoveries, sustaining capital, transport costs and royalties.

  • Stope designs are based on a cut-off grade of 2.0g/t and then assessed within the mining schedule scenario, to determine value for the business. Stope design grades are subject to review as a part of the ongoing optimisation of the integrated operational plan.

  • Development material was considered in the Ore Reserve estimate if the material could cover the cost of haulage and processing (1.4g/t)

  • Inputs into the cut-off grade calculation include:

  • Incremental Stoping and Grade Control Cost = AUD$60/t

  • Processing Costs = AUD$31/t ore

  • Site Administration Cost = AUD$23/t ore

  • Metallurgical Recovery = 84% (average across all mining units of which are detailed in Metallurgical section)

  • Royalties = 2.5%

  • Gold Price = AUD$2,600/oz


  • Mining factors or assumptions


  • The Ore Reserves estimate is reported within an underground Shape Optimiser (SO) evaluation from the depleted resource model.  SO input parameters include a 2.0 g/t Au cut-off, minimum mining width of 3m (with a 1.0m dilution halo applied on both hanging wall and footwall of each stope shape), minimum stope length of 5m, stope height of 15m and a gold price of AUD$2,600/oz.

  • The orientation of SO's is variable depending on the geometry of the mineralisation.

  • The Ore Reserves estimate is based on long-hole open stoping with no fill, the mining method currently applied at Plutonic Operation. If a stope can be filled with waste rock, it will be filled, however it is not a geotechnical requirement for mining.

  • Development, stopes/SO Shapes and schedule have been prepared for the entirety of the Ore Reserve estimate.

  • Plutonic has been in operation for 28 years, whereby various mining methods have been used in the past (room and pillar, LHOS with paste fill/ rock fill or no fill) The historic voids have been incorporated into the MRE and coded to ensure the method of fill determines proximity of stope shape generation.

  • Unclassified and inferred material have not been included within the Ore Reserves, however if the material is mined as a consequence to mining an Ore Reserve estimated stope, then material had a zero grade assigned and was therefore treated as waste.

  • The Modifying factors are validated via a routine reconciliation process, whereby on completion of each stope, the stope is compared to the estimate from mining planning and Ore Reserve estimate.

  • Dilution of 10% is applied to the in-situ stope ore tonnes and the ore recovery of 95% is applied. Development had no dilution applied and 100% mining recovery assumed.

  • Recovery and cost estimates are based on actual site operating data and engineering estimates.


Metallurgical factors or assumptions

The Plutonic Gold Mine has been in operation since 1990. The original process plant ("PP1") consisted of an open circuit jaw crusher, coarse ore stockpile, semi-autogenous grinding ("SAG") mill and ball mills, two leach tanks, and six carbon adsorption tanks. A three-stage hard rock crushing circuit was incorporated in 1994 which included a fine ore bin and an additional ball mill. A second process plant ("PP2") was added in 1996 utilising the original PP1 jaw crusher and coarse ore stockpile and adding SAG and ball mills, two additional leach tanks and six additional carbon adsorption tanks. A 16 MW gas power station was added in 1997 and upgraded with new sets in 2014 and 2020 respectively.

PP1 was designed for the treatment of primary ore while PP2 was designed to process oxide ore. At the end of June 2004, oxide ore sources were exhausted and the crushing and milling components of PP2 were shutdown. However, the leach and carbon adsorption circuit of PP2 was run in parallel with the PP1 leach/adsorption circuit. In April 2008 the PP2 leach and carbon adsorption circuit was emptied, cleaned, and placed into care and maintenance as part of a strategy to reduce the site power load and power consumption due to power restrictions caused by the June 2008 gas supply crisis. The four tanks in the PP2 leach and carbon adsorption circuit that were re-commissioned in June 2010 were shut down in 2012.


The primary sections of the processing plant that are currently in use are:

  • Crushing and conveying

  • Ore reclaim and grinding

  • Leaching and carbon adsorption

  • Carbon stripping, electro winning, refining and carbon regeneration

  • Tailings thickening

  • Tailings deposition and storage

  • Reagent mixing and handling

  • Plant services

Plant performance for the past five years indicates reasonable performance, with recoveries ranging from 76% to 90%, and an average recovery in 2023 of 85%. Metallurgical recoveries used to generate the Mineral Reserves were based on site production data and detailed metallurgical testing to an appropriate standard. A summary of the metallurgical recoveries used to determine the cut-off grades is shown in Table 2


Mining Area

Met. Recovery

A134

88.80 %

Baltic

94.00 %

Caspian

81.90 %

Cortez

88.80 %

Indian

83.10 %

Pacific

79.30 %

Plutonic East

84.20 %

Timor

93.50 %


Criteria

Commentary

Environmental

Plutonic maintains a register of legal and regulatory requirements which is updated regularly. The register captures the requirements of relevant environmental legislation.


Construction of the Plutonic Gold Mine site commenced following the submission of a Notice of Intent ("NoI") in 1989 to the Department of Mines and Petroleum ("DMP"), which is now the Department of Mines, Industry Regulation and Safety ("DMIRS"). DMIRS administers and regulates the activities of the mining industry under the provisions of the Mining Act. NoI documents, now known as mining proposal(s) ("MP"), detail the environmental impacts associated with the Project and provide a list of environmental commitments made to manage those impacts in a responsible manner. DMIRS assesses, approves, and manages MP applications, including the associated mine closure plan ("MCP") requirements. There have been several MPs that have been approved to date. The key Plutonic MPs that have been granted for Superior are:

  • (Reg. ID 81643) "Mining Proposal, Plutonic Gold Mine, Tailings Storage Facility 4 and 5 (M52/148 and M52/170)", dated August 6, 2019.

  • "Mining Proposal, Plutonic Gold Mine, Area 4 and Perch Pit Expansions (M52/148, M52/149, M52/170, M52/295 and M52/301)", dated December 6, 2019. 

  • "Mining Proposal, Plutonic Gold Mine, Area 4 and Perch Pit Expansions (M52/148, M52/149, M52/170, M52/295 and M52/301)", dated March 12, 2020. 


The Department of Water and Environmental Regulation (the "DWER") licenses water abstraction and pollution discharge activities. Plutonic operates in accordance with Part V of the Western Australian Environmental Protection Act 1986 (the "EP Act") under Operating Licence L6868/1989/12, first issued by the DWER predecessor, the Department of Environment Regulation (the "DER") in September 2014. Plutonic has obtained and maintained requirements under Operating Licence L6868/1989/12 for the following prescribed premises to date:

  • Category 5 – Processing or beneficiation of metallic ore

  • Category 6 – Mine dewatering 

  • Category 52 – Electric power generation 

  • Category 54 – Sewage facility 

  • Category 57 – Used tyre storage (general)

  • Category 89 – Putrescible landfill site.


A Native Vegetation Clearing Permit ("NVCP") under Part V of the EP Act and the Environmental Protection (Clearing of Native Vegetation) Regulations 2004 is required to be obtained prior to the commencement of any native vegetation clearing, together with a MP approval from DMIRS. The Project has obtained a number of historic clearing permits to date. The current and most relevant approved NVCPs are:

  • CPS 7555 in relation to clearing for Hermes. 

  • CPS 8616 in relation to clearing for TSF4/5. 

  • CPS 8651 in relation to clearing for Area 4. 


The abstraction of groundwater for water supply and/or mine dewatering purposes requires licences to be issued by the DWER (Water Section) under section 5C of the Rights in Water and Irrigation Act 1914 (the "RIWI Act"). Plutonic conducts dewatering from open pits and underground, and abstracts production and potable water from Borefields 1 and 2 which are located 30 km and 15 km west of the Plutonic plant. The Project has obtained water licences under the RIWI Act as follows:

  • GWL151450 – Plutonic Mine water supply and dewatering. 

  • GWL182889 - Hermes Haul Road water supply. 

  • GWL183063 Hermes Mine water supply and dewatering (now expired). 


Activities undertaken onsite are required to be undertaken in accordance with the above environmental approvals. Monitoring programs are conducted to ensure that key approval and licence requirements are complied with.


Infrastructure

The Plutonic Gold Mine is a well-established mine which has services and infrastructure consistent with an isolated area operating mine.

The existing site infrastructure is capable of supporting the mine plans as historically the site has successfully operated at production rates significantly higher than those envisaged

Costs

  • Capital and operating costs are derived from forward looking estimates based on current contracts and historic averages achieved.

  • Allowances have been made for State royalties (2.5%) payable on net revenue.


Revenue factors

The Ore Reserves estimation utilises the current operational costs with an estimated Gold Price of $A2,600/oz.

Market assessment

Gold metal is a freely and widely traded commodity with a transparent mechanism for setting prices and for sale of gold produced.

Catalyst has not conducted any studies or analyses such as commodity price projections, product valuations, market entry strategies, or product specification requirements.

Economic

  • The Plutonic operation is economically robust and generates positive NPV and IRR using the afore mentioned costs, revenue factors and discount rate of 10%.

  • The economic analysis is presented in real terms


Social

  • Demonstrated strong environmental and social performance, there are no identified threats that place the companies social licence to operate at risk.


Other

  • None noted


Classification

  • The Ore Reserves classification reflects the Competent Person's view of the deposit. Only Probable reserves have been declared and are based on Indicated Resources following consideration of modifying factors.

  • No probable Ore Reserves are derived from Measured Resources.


Audits or reviews

  • No review has been conducted on the Ore Reserves.


Discussion of relative accuracy/ confidence

  • In the opinion of the Competent person, the Ore Reserve estimate is underpinned with over 28 years of operating experience feeding into an appropriate design, schedule and cost estimate to a feasibility study level or greater.


Section 1 Sampling Techniques and Data
Trident Deposit
(Criteria in this section apply to all succeeding sections.)

Criteria

Commentary

Sampling techniques

  • Diamond drilling assays are from mostly half core and minor quarter core, NQ2 and HQ size core. This was considered to be sufficient material for a representative sample. Core samples were taken at 1 m intervals or at geological boundaries.

  • RC drilling assays are from 1 m samples split on the cyclone for the ultramafics. 4 m composites from these 1 m splits are taken in the cover sequence. Historical RC samples were collected as 4 m composite spear samples. Mineralised zones were sampled at 1 m intervals using a 1/8 riffle splitter.


Drilling techniques

  • Reverse Circulation drilling was conducted utilizing 5.75 inch face sampling bit.

  • Diamond drilling was conducted utilising NQ2 core. Core was orientated by spear methodology.


Drill sample recovery

  • Recovery in diamond drilling based on measured core returned for each 3 m.

  • RC drilling was bagged on 1 m intervals and an estimate of sample recovery has been made on the size of each sample.

  • No assessment of RC chip sample recoveries was undertaken on historical data however a comprehensive historical review of sampling procedures was undertaken which indicates that standard procedures where enacted to ensure minimal sample loss. Where limited information on the recoveries has been recorded, they have been consistent with those noted by recent drilling.


Logging

  • Reverse Circulation holes are being logged on 1 m intervals.

  • Diamond holes are logged in detail based on geological boundaries.

  • Diamond holes are logged on 1 m intervals for geotechnical data.

  • Diamond core was photographed prior to cutting and sampling.

  • Geotechnical logging including RQD, recovery and FF completed on diamond holes.

  • Magnetic Susceptibility (KT 10) recorded.

  • Historical Work:

    • Historical Geological logs have been examined (WAMEX) in both hard copy and digital files. Logging codes have varied, but careful reconstruction of the geological sections has shown good correlation with the broad lithological logging.

    • Historical procedures are generally similar to that used currently.


Sub-sampling techniques and sample preparation

  • Half and quarter Diamond Core - Diamond drilling, on selected intervals of between 0.8-1.25 m length.

  • Sampling using a diamond saw.

  • Standards submitted every 20 samples of tenor similar to those expected in the sampling.

  • Blanks were inserted every 20 samples.

  • RC Drilling sampled on 1 m samples using a cone splitter within the cyclone.

  • In less prospective lithologies these 1 m samples were composited using a scoop over 4 m intervals.

  • Historical Work:

    • RC – 1 m samples collected at the rig using a 1:8 riffle splitter. Each sample was riffle split each 1 m sample to collect approximately 2 kg samples in calico bags, with the remaining sample retained on site in plastic bags. Four metre composite samples were also collected with any samples assaying greater than 0.1 g/t Au being re-split to 1 m intervals.

    • Core sampled was halved using a diamond saw and sampled at 1 m intervals, or to geological contacts.

    • Field duplicate sampling was completed by passing the bulk reject sample from the plastic bag through a riffle splitter. In addition, ¼ core was routinely submitted. Duplicate sample intervals were designated by the geologist.

    • Sampling procedures for the Resolute drilling were not available.


Quality of assay data and laboratory tests

  • Samples analysed at Intertek Laboratories using a 50 g Fire Assay method.

  • Samples are dried, crushed and pulverised prior to analysis.

  • Standards submitted every 20 samples of tenor similar to those expected in the sampling.

  • Blanks were inserted every 20 samples.

  • Historical Work:

    • Gold was analysed at Amdel in Perth using fire assay with a 50 g charge for Au.

    • Drilling programs carried out at Trident by HGAL have included ongoing QAQC procedures. These included the use of certified standards, blanks, check assay and duplicate sampling.

    • The various programs of QAQC carried out by HGAL have all produced results which support the sampling and assaying procedures used at the site.

    • Specific QAQC procedures for previous owners were unavailable.


Verification of sampling and assaying

  • RC and diamond drilling are verified by the geologist first and then the database administrator before importing into the main database.

  • A comparison of the database as current with all data from the 2019 Annual Resource was conducted to ensure the data did not change. Any discrepancies were investigated and fixed.

  • Recent diamond drilling has twinned historical holes confirming assays and geological understanding.

  • Verification of assay and survey data was undertaken through the analysis of primary source data obtained through WAMEX.


Location of data points

  • Downhole surveys are visually inspected for anomalous changes in drill trace, (i.e. does the drill hole bend 90 degrees).

  • Data is fixed in main database when discovered.

  • A database check was conducted on all new data from original source by spot checking, collars and downhole surveys.

  • All drill collars have been accurately located by a licensed surveyor using DGPS. Recent downhole survey data collected by Westdrill using an Axis Mining Technology Champ North Seeking Gyro tool.

  • Previous downhole survey data collected by REFLEX gyro tool and historically with Eastman cameras with follow-up down-hole surveys carried out by Surtron using gyroscopic survey equipment.


Data spacing and distribution

  • Drill spacing of approximately 20 m (along strike) by 20 m (on section) was considered adequate to establish both geological and grade continuity.

  • Broader spaced drilling has also been modelled but with lower confidence. Some sections have closer spacing in high grade zones confirming the continuity and structural understanding.


Orientation of data in relation to geological structure

  • The orientation of a majority of the drilling is approximately perpendicular to the strike and dip of the mineralisation and is unlikely to have introduced any sampling bias.

  • Certain holes have drilled parallel to key structures, but density of drilling and drilling on other orientations has allowed detailed geological modelling of these structures and hence any sampling bias in a single hole has been removed.


Sample security

  • Samples were bagged and labelled by company geologists or geological assistants and sealed in bulka bags with a security seal that remains unbroken when delivered to the lab.

  • No specific information has been obtained relating to historical sampling security.


Audits or reviews

  • A review of standards, blanks and duplicates indicate sampling and analysis has been completed with no issues discovered.

  • Databases for the Trident area were examined and a proportion of holes were compared to original data sources and found to be consistent wherever checked.


Section 2 Reporting of Exploration Results
Trident Deposit
(Criteria listed in the preceding section also apply to this section.)

Criteria

Commentary

Mineral tenement and land tenure status

  • Located in the Marymia - Plutonic Greenstone Belt ~218 km northeast of Meekatharra in the Midwest mining district in WA

  • M52/217 – granted tenement in good standing.

  • The tenement predates Native title interests, but is covered by the Gingirana Native Title claim.

  • The tenement is 100% owned by Vango Mining Limited and subsidiary Dampier Plutonic Pty Ltd.

  • Gold production will be subject to a 2.5% government royalty.


Exploration done by other parties

  • Comprehensive drilling of the deposit was first undertaken by Resolute Limited from 1995 to 1998 completing approximately 263 RC and 37 DD holes.

  • From 1999 Homestake and then later Barrick Gold (2002) completed numerous drilling campaigns at Trident.

  • Dampier Gold completed RC and DD programs at Trident from 2012 until 2014 when Vango Mining took over the project completing 6 DDholes for 946 metres plus three RC holes for 747 metres.

  • Catalyst consolidated the belt in 2023 following the successful acquisition of Vango Mining and the merger with Superior Gold Inc. 

  • Catalyst has undertaken in 2023 a comprehensive infill and extensional DD program which has been included in this MRE update.


Geology

  • Gold mineralisation at Trident Extended is orogenic, hosted within a sheared contact zone in ultramafic rocks. High grade 'shoots' of mineralisation are associated with flexures in the mineralised host shear zones between steeply dipping structures.


Drill hole Information

Vango Work


  • Location of drillholes based on historical reports and data, originally located on surveyed sites, and DGPS.

  • Northing and easting data generally within 0.1 m accuracy

  • RL data +-0.2 m

  • Down hole length =+- 0.1 m

Historical Work

  • The majority of drill holes used in the resource estimate have been accurately surveyed by qualified surveyors using DGPS. Down hole surveys have been conducted at regular intervals using industry- standard equipment.

  • Where single shot cameras were used some magnetic units have affected the azimuth readings and these have not been used. Many holes have been surveyed using Gyro tools.

  • Approximately 100 holes have only planned collar coordinates or nominal down hole surveys.

Data aggregation methods

  • No exploration has been reported in this release, therefore there are no drill hole intercepts to report. This section is not relevant to this report on Mineral Resource and ore Reserves.


Relationship between mineralisation
widths and intercept lengths

  • No exploration has been reported in this release, therefore there are no drill hole intercepts to report. This section is not relevant to this report on Mineral Resource and ore Reserves.


Diagrams

  • No exploration has been reported in this release, therefore there are no drill hole intercepts to report. This section is not relevant to this report on Mineral Resource and ore Reserves.


Balanced reporting

  • No exploration has been reported in this release, therefore there are no drill hole intercepts to report. This section is not relevant to this report on Mineral Resource and ore Reserves.


Other substantive exploration data

  • No exploration has been reported in this release, therefore there are no drill hole intercepts to report. This section is not relevant to this report on Mineral Resource and ore Reserves.


Further work

  • No new work is currently planned.


Section 3 Estimation and Reporting of Mineral Resources
Trident Deposit
(Criteria listed in section 1, and where relevant in section 2, also apply to this section.)

Criteria

Commentary

Database integrity

  • Current work has been plotted and examined in Leapfrog and Surpac in detail along with the existing extensive database.

  • Any potential discrepancies have been examined and corrected where necessary.

  • All data has been loaded into the Explorer3 RDBMS and has undergone validation procedures.

  • Some data within the existing database has been adjusted based on review with the original source data from historical reporting.

  • Previous data was sourced from databases previously reviewed by Runge in 2010.

  • Structural and geotechnical data was collected from hard copy reports in several instances to enhance the geological and geotechnical database.


Site visits

  • The competent person has not undertaken a site visit at the time of this release.


Geological interpretation

  • Current work has included the drilling of 27 Diamond holes (2023) within the area.

  • This data in addition to the previous database of over 600 holes has allowed detailed geological interpretation of the system.

  • Detailed geological logging was completed on the diamond drillholes and used to interpret previous logging.

  • RQD and magnetic susceptibility data was also used to define structures and geological units in conjunction with the geological logging.

  • Structural logging from this program and previous diamond logging was used to inform the geological model.

  • Biotite alteration was a common companion to gold mineralisation and shows a strong correlation.

  • There is high confidence in the geological model which shows two distinct zones a shallow northwest dipping structure of 2- 10 m thickness parallel to thrusting, and a steep, wider folded zone adjacent to steep controlling faults within the deposit.

  • Cross-faulting does appear to displace the mineralisation causing some breaks in continuity. The location of these structures is of moderate confidence.


Dimensions

  • Mineralisation extends over a strike length (East – West) of approximately 1,100 m and down-dip up to 520 m. Mineralisation currently extends to a depth of approximately 350 m below surface.


Estimation and modelling techniques

  • Gold grade was estimated using ordinary kriging in Surpac Software. It was considered that a more robust geological model with smoother and more continuous mineralised lodes will reduce the effects of higher CV.

  • Variograms were generated using composited drill data in Snowden Supervisor v8 software.

  • The ellipsoid search parameters were based on the variogram ranges, with the search ellipse dimensions similar to the variogram range, with anisotropies retained. Hard boundaries were used for the estimate.

  • To enable the use of dynamic variograms and search orientations during the estimation of gold, the reference surfaces for each domain were exported from the Leapfrog project. This is calculated as the best fit surface using the hanging wall and footwall surfaces.

  • A minimum of 8 and maximum of 16 (1 m composite) samples per block were used with a maximum of 5 samples per drillhole. The minimums and maximums were established through independent KNA on each major domain. Block discretisation was set at 5 E x 5 N x 3 RL points (per parent block).

  • Octant restrictions were not used, and estimates were into parent blocks, not sub-blocks.

  • No deleterious elements were estimated or assumed.

  • Block sizes were selected based on drill spacing and the thickness of the mineralised veins.

  • Drill spacing varied from 20 by 20 metres up to 80 by 80 metres. Block sizes varied depending on lode orientation and drillhole spacing. In the flatter areas with closer spaced drilling, block dimensions were 10 x 10 x 5 metres (XYZ) and increased to 40 x 40 x 20 metres (XYZ) in the wider spaced drilling. For the vertical domains block dimensions were 10 x 5 x 10 metres (XYZ). Sub-celling in all domains was 1.25 m x 1.25 m x 1.25 m to accurately reflect the volumes of the interpreted wireframes.

  • No selective mining units were assumed in the resource estimate.

  • Only Au grade was estimated.

  • Top cuts and distance limiting were applied to the data to control the effects of outlier high grade Au values that were considered not representative. The effect of the top cuts was reviewed with respect to the resulting Mean and CV values.

  • The model was validated by comparing statistics of the estimated blocks against the composited sample data; visual examination of the of the block grades versus assay data in section; swath plots; and reconciliation against previous production.


Moisture

  • All estimations were carried out using a 'dry' basis.


Cut-off parameters

  • Trident Mineral Resources are reported at a cut-off grade of 2.0 g/t Au. The cut-off grade has been derived from current DFS mining and processing costs and parameters.

  • Inputs into the cut-off grade calculation include:

    • Mining Cost = AUD$101.33/t ore

    • Processing and Surface Haulage Costs = AUD$38.40/t ore

    • Site Administration Cost = AUD$5.58/t ore

    • Metallurgical Recovery = 83.5%

    • Royalties = 2.5%

  • Gold Price = AUD$2,800/oz


Mining factors or assumptions

  • The Trident Mineral Resource estimate is reported within an underground Shape Optimiser (SO) evaluation from the undiluted model.  SO input parameters include a 2.0 g/t Au cut-off, minimum mining width of 2m, minimum stope length of 2.5m, minimum stope height of 5m and a gold price of AUD$2,800/oz.

  • The orientation of SO's is variable depending on the geometry of the mineralisation.


Metallurgical factors or assumptions

  • It is assumed the material will be trucked and processed at the Plutonic Gold Plant. Recovery factors are assigned based on lab test work, and on-going experience.

  • No metallurgical assumptions have been built or applied to the resource model.


Environmental factors or assumptions

  • A conventional storage facility is used for the process plant tailings.

  • The small amount of waste rock is stored in a traditional waste rock landform 'waste dump'. Due to low sulphide content and the presence of carbonate alteration the potential for acid content is considered low.


Bulk density

  • Density has been assigned to the resource using interpreted weathering surfaces determined from drill hole logging.

  • Bulk density was coded by oxidation type.

  • Oxide and Transitional and Fresh density was coded as 1.8, 2.4 and 2.9 respectively.

  • Over 200 density measurements were available for review predominantly in fresh material. Data was imported into Leapfrog software and statistics were compared for mineralised zones/waste and different lithologies.

  • With limited data available for oxide and transitional domains they have defaulted to what had been coded previously and what has been used in the nearby Marwest Pit.


Classification

  • Factors considered when classifying the model include:

    • The portions of the 2023 MRE classified as Indicated have been flagged by medium to high quality estimation parameters, an average distance to nearest sample of 25 m. The drill spacing within the Indicated portion of the resource is appropriate for defining the continuity and volume of the mineralised domains, at a nominal 20 m drill spacing on 20 m sections.

    • The portions of the 2023 MRE classified as Inferred represent typically minor lodes with less than three drillholes and portions of domains where geological continuity is present but not consistently confirmed by 20 m x 20 m drilling  The Inferred portions of the MRE are defined by lower quality of estimation parameters, an average slope of regression (true to estimated block) of < 0.3 and an average distance to composites used of > 30 m.

    • Further considerations of resource classification include; data type and quality (drilling type, drilling orientations, down hole surveys, sampling and assaying methods); geological mapping and understanding; statistical performance including number of samples, slope regression and kriging efficiency.

    • The Mineral Resource estimate appropriately reflects the view of the Competent Person.


Audits or reviews

  • The geological interpretation, estimation parameters and validation of the resource model was peer reviewed by Catalyst staff.

  • No external reviews of the resource estimate had been carried out at the time of writing.


Discussion of relative accuracy/ confidence

  • The relative accuracy of the Mineral Resource estimate is reflected in the reporting of the Mineral Resource as per the guidelines of the 2012 JORC Code.

  • The statement relates to the global estimates of tonnes and grade.

  • Interpretation was altered in 2023 to better the information gained by mining open pits in the vicinity.

  • The estimated uncertainty for an indicated resource is typically +/- 20%

  • In most cases it is considered that only development/face sampling in conjunction with 20m x 20m drill spacing is sufficient to attain enough confidence for stoping.


Catalyst Metals LTD. Logo (CNW Group/Catalyst Metals LTD.)
CisionCision
Cision

View original content to download multimedia:https://www.prnewswire.com/news-releases/plutonic-and-trident-mineral-resource--ore-reserve-update-302007825.html

SOURCE Catalyst Metals LTD.

Advertisement