PNE Industries Ltd (SGX:BDA) Delivered A Weaker ROE Than Its Industry

One of the best investments we can make is in our own knowledge and skill set. With that in mind, this article will work through how we can use Return On Equity (ROE) to better understand a business. We’ll use ROE to examine PNE Industries Ltd (SGX:BDA), by way of a worked example.
PNE Industries has a ROE of 6.5%, based on the last twelve months. That means that for every SGD1 worth of shareholders’ equity, it generated SGD0.065 in profit.
Check out our latest analysis for PNE Industries
How Do I Calculate Return On Equity?
The formula for return on equity is:
Return on Equity = Net Profit ÷ Shareholders’ Equity
Or for PNE Industries:
6.5% = 5.263 ÷ S$81m (Based on the trailing twelve months to September 2018.)
Most know that net profit is the total earnings after all expenses, but the concept of shareholders’ equity is a little more complicated. It is all earnings retained by the company, plus any capital paid in by shareholders. The easiest way to calculate shareholders’ equity is to subtract the company’s total liabilities from the total assets.
What Does Return On Equity Signify?
ROE measures a company’s profitability against the profit it retains, and any outside investments. The ‘return’ is the amount earned after tax over the last twelve months. That means that the higher the ROE, the more profitable the company is. So, as a general rule, a high ROE is a good thing. That means ROE can be used to compare two businesses.
Does PNE Industries Have A Good ROE?
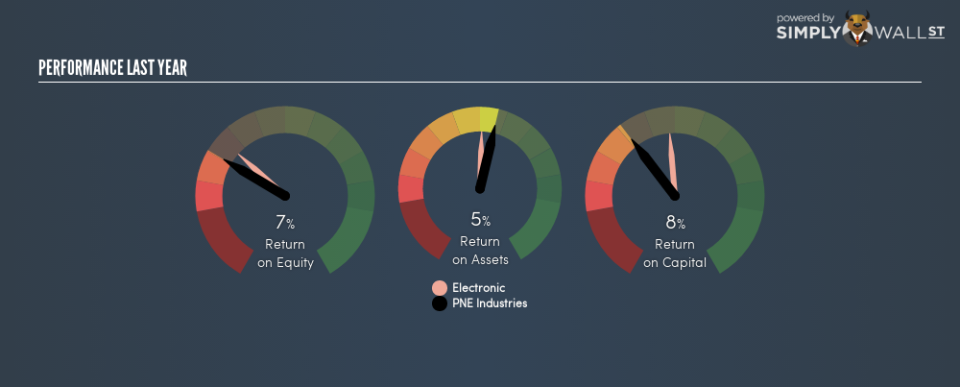
Arguably the easiest way to assess company’s ROE is to compare it with the average in its industry. However, this method is only useful as a rough check, because companies do differ quite a bit within the same industry classification. As shown in the graphic below, PNE Industries has a lower ROE than the average (8.3%) in the Electronic industry classification.
Unfortunately, that’s sub-optimal. It is better when the ROE is above industry average, but a low one doesn’t necessarily mean the business is overpriced. Still, shareholders might want to check if insiders have been selling.
Why You Should Consider Debt When Looking At ROE
Companies usually need to invest money to grow their profits. The cash for investment can come from prior year profits (retained earnings), issuing new shares, or borrowing. In the case of the first and second options, the ROE will reflect this use of cash, for growth. In the latter case, the use of debt will improve the returns, but will not change the equity. Thus the use of debt can improve ROE, albeit along with extra risk in the case of stormy weather, metaphorically speaking.
Combining PNE Industries’s Debt And Its 6.5% Return On Equity
PNE Industries is free of net debt, which is a positive for shareholders. So although its ROE isn’t that impressive, we shouldn’t judge it harshly on that metric, because it didn’t use debt. At the end of the day, when a company has zero debt, it is in a better position to take future growth opportunities.
In Summary
Return on equity is useful for comparing the quality of different businesses. A company that can achieve a high return on equity without debt could be considered a high quality business. All else being equal, a higher ROE is better.
But when a business is high quality, the market often bids it up to a price that reflects this. The rate at which profits are likely to grow, relative to the expectations of profit growth reflected in the current price, must be considered, too. So I think it may be worth checking this free this detailed graph of past earnings, revenue and cash flow .
If you would prefer check out another company — one with potentially superior financials — then do not miss this free list of interesting companies, that have HIGH return on equity and low debt.
To help readers see past the short term volatility of the financial market, we aim to bring you a long-term focused research analysis purely driven by fundamental data. Note that our analysis does not factor in the latest price-sensitive company announcements.
The author is an independent contributor and at the time of publication had no position in the stocks mentioned. For errors that warrant correction please contact the editor at editorial-team@simplywallst.com.
