PNW or NI: Which is a Better Utility Electric Power Stock?
Utilities have been benefiting from various favorable factors, such as new electric rates, customer additions, cost management and the implementation of energy-efficient programs. Also, the investments to improve the resiliency of electric infrastructure against extreme weather conditions and the transition to cost-effective, renewable energy sources to produce electricity have been aiding the electricity power industry.
Regardless of economic cycles, there is a relatively constant demand for the services offered by utilities, with the exception of significant weather variations.
A clear transition is evident in this industry, with more companies declaring zero-emission goals. Research and development over the years have resulted in a substantial decline in the cost of setting up utility-scale renewable power projects, aiding in reducing emissions.
Most of the companies have pledged to deliver 100% clean energy and achieve the zero-emission target in the coming years. According to the U.S. Energy Information Administration, the annual share of U.S. electricity generation from renewable energy sources will increase 24% and 25% in 2024 and 2025, respectively.
In this blog, we run a comparative analysis on two Zacks Utility — Electric Power companies — Pinnacle West Capital Corporation PNW and NiSource NI — to decide which one is a better pick for your portfolio.
The stocks carry a Zacks Rank #2 (Buy) each at present. You can see the complete list of today’s Zacks #1 Rank (Strong Buy) stocks here.
Pinnacle West Capital has a market capitalization of $8.17 billion, while NiSource has $12.07 billion.
Growth Projections
The Zacks Consensus Estimate for PNW’s 2024 earnings is pinned at $4.80 per share on revenues of $4.87 billion. This implies a year-over-year bottom-line increase of 8.8% and revenue growth of 3.7%.
The Zacks Consensus Estimate for NI’s 2024 earnings is pegged at $1.71 per share on revenues of $6.14 billion. This indicates year-over-year bottom-line growth of 6.9% and a revenue increase of 11.5%.
Return on Equity (ROE)
ROE is a measure of a company’s efficiency in utilizing shareholders’ funds. The current ROE for Pinnacle West Capital and NiSource is 8.02% and 10.11%, respectively, compared with the industry’s 8.82%.
Debt Position
The debt-to-capital ratio is a vital indicator of the financial position of a company. It shows the amount of debt used to run a business. Currently, Pinnacle West Capital and NiSource have a debt-to-capital of 58.95% and 58.23%, respectively, compared with the industry’s 61.51%.
The times interest earned ratio for PNW is 2.6, and the same for NI is 2.7. Since both companies have a TIE ratio exceeding one, it indicates that both of them have enough financial flexibility to meet their near-term interest obligations.
Dividend Yield
Utility companies generally distribute regular dividends and increase shareholders’ value. Currently, the dividend yield for Pinnacle West Capital is 4.89% and the same for NiSource is 3.93%. The dividend yields of these companies are better than the Zacks S&P 500 Composite’s average of 1.30%.
Price Performance
In the past six months, shares of NI have risen 7.1%, compared with the industry’s growth of 2.1%. However, shares of PNW have declined 2.9% during the same time period.
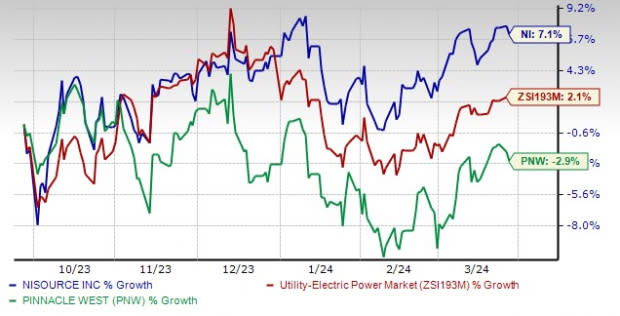
Image Source: Zacks Investment Research
Outcome
Both Pinnacle West Capital and NiSource are evenly matched and good picks for your portfolio. They have the potential to improve further from their current position and serve the needs of their growing customer base. However, our choice at this moment is NI, given its better return on equity, debt management and better price performance than PNW.
Want the latest recommendations from Zacks Investment Research? Today, you can download 7 Best Stocks for the Next 30 Days. Click to get this free report
NiSource, Inc (NI) : Free Stock Analysis Report
Pinnacle West Capital Corporation (PNW) : Free Stock Analysis Report
