Is PPL (PPL) Too Good to Be True? A Comprehensive Analysis of a Potential Value Trap
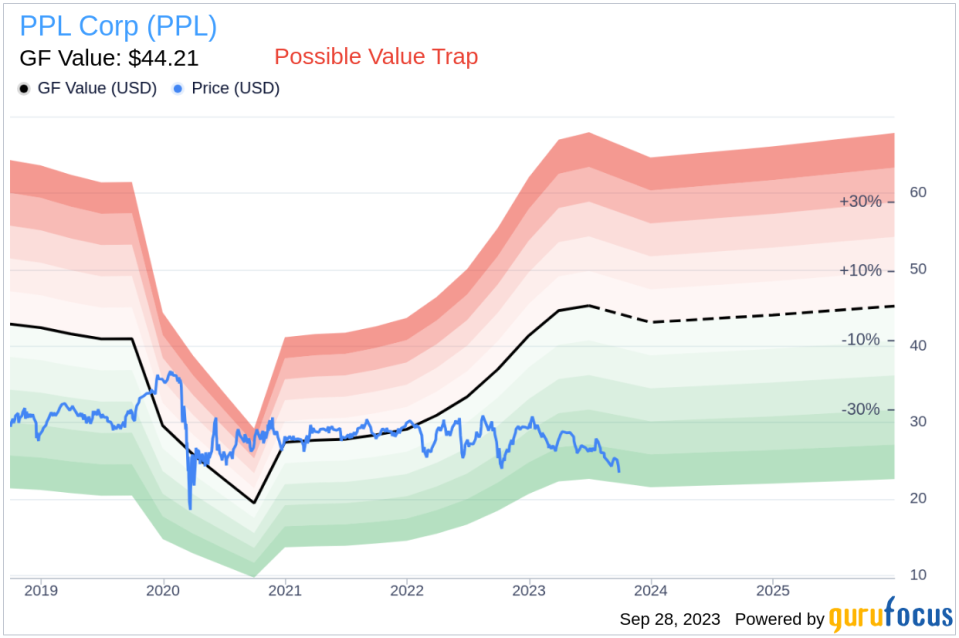
Value-focused investors are constantly on the lookout for stocks that are currently undervalued. PPL Corp (NYSE:PPL) is one such stock that has caught the attention of many due to its current price of 23.46, which has recorded a loss of 2.03% in a day and a 3-month decrease of 9.65%. According to its GF Value, the fair valuation of the stock is $44.21.
Understanding GF Value
The GF Value is a unique method that calculates the current intrinsic value of a stock. The GF Value Line provides an overview of the fair value at which the stock should be traded. This calculation is based on three key factors: historical multiples that the stock has traded at, GuruFocus adjustment factor based on the company's past returns and growth, and future estimates of the business performance. The GF Value Line is considered the fair value at which the stock should be traded. If the stock price is significantly above the GF Value Line, it is overvalued and its future return is likely to be poor. Conversely, if it is significantly below the GF Value Line, its future return will likely be higher.
However, before making an investment decision, investors must consider a more in-depth analysis. Despite its seemingly attractive valuation, certain risk factors associated with PPL Corp (NYSE:PPL) should not be overlooked. These risks are primarily reflected through its low Altman Z-score of 0.9, and a Beneish M-Score of -1.73 that exceeds -1.78, the threshold for potential earnings manipulation. Additionally, the company's revenues and earnings have been on a downward trend over the past five years. This raises a crucial question: Is PPL a hidden gem or a value trap? These indicators suggest that PPL, despite its apparent undervaluation, might be a potential value trap. This complexity underlines the importance of thorough due diligence in investment decision-making.
Understanding the Altman Z-Score and Beneish M-Score
The Altman Z-score is a financial model invented by New York University Professor Edward I. Altman in 1968. This model predicts the probability of a company entering bankruptcy within a two-year time frame. The Altman Z-Score combines five different financial ratios, each weighted to create a final score. A score below 1.8 suggests a high likelihood of financial distress, while a score above 3 indicates a low risk.
On the other hand, the Beneish M-Score is based on eight financial variables that reflect different aspects of a company's financial performance and position. These variables include Days Sales Outstanding (DSO), Gross Margin (GM), Total Long-term Assets Less Property, Plant and Equipment over Total Assets (TATA), change in Revenue (?REV), change in Depreciation and Amortization (?DA), change in Selling, General and Admin expenses (?SGA), change in Debt-to-Asset Ratio (?LVG), and Net Income Less Non-Operating Income and Cash Flow from Operations over Total Assets (?NOATA).
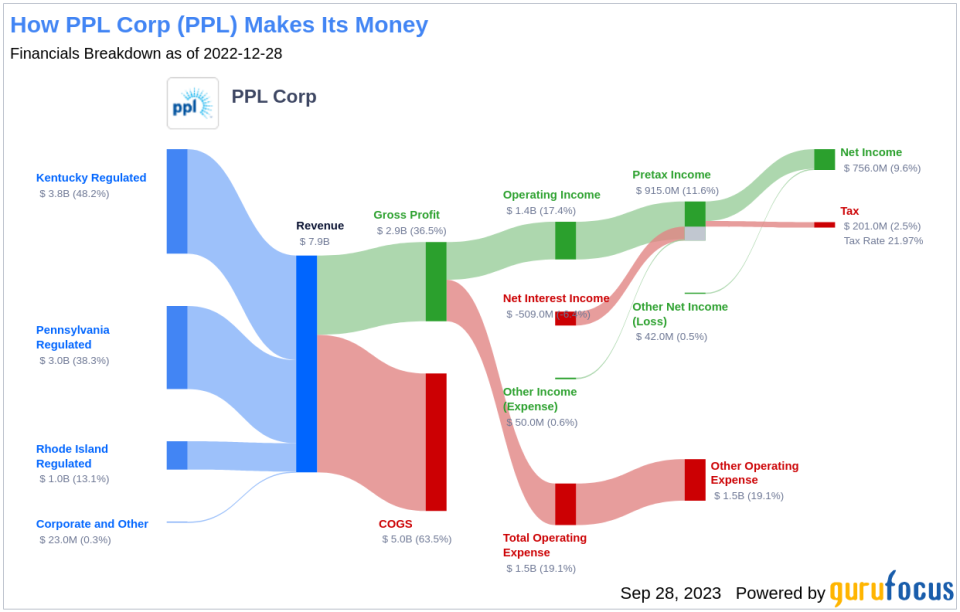
Introduction to PPL Corp (NYSE:PPL)
PPL Corp (NYSE:PPL) is a holding company of regulated utilities in Pennsylvania, Kentucky, and Rhode Island. The Pennsylvania regulated delivery and transmission segment distributes electricity to customers in central and eastern Pennsylvania. LG&E and KU are involved in regulated electricity generation, transmission, and distribution in Kentucky. The Kentucky utilities also serve gas customers. Narragansett operates electric and gas utilities in Rhode Island.
PPL's Low Altman Z-Score: A Breakdown of Key Drivers
A closer look at PPL's Altman Z-score reveals that the company's financial health may be weak, suggesting a possibility of financial distress. The Gross Margin index, which tracks the evolution of a company's gross profit as a proportion of its revenue, shows a downward trend. This could indicate issues such as overproduction or more generous credit terms, both of which are potential red flags for earnings manipulation. By examining the past three years of PPL's historical data (2021: 49.49; 2022: 42.90; 2023: 36.11), we find that its Gross Margin has contracted by 5.97%. Such a contraction in the gross margin can negatively impact the company's profitability as it signifies lesser income from each dollar of sales. This could put a strain on the company's capacity to manage operating costs, potentially undermining its financial stability.
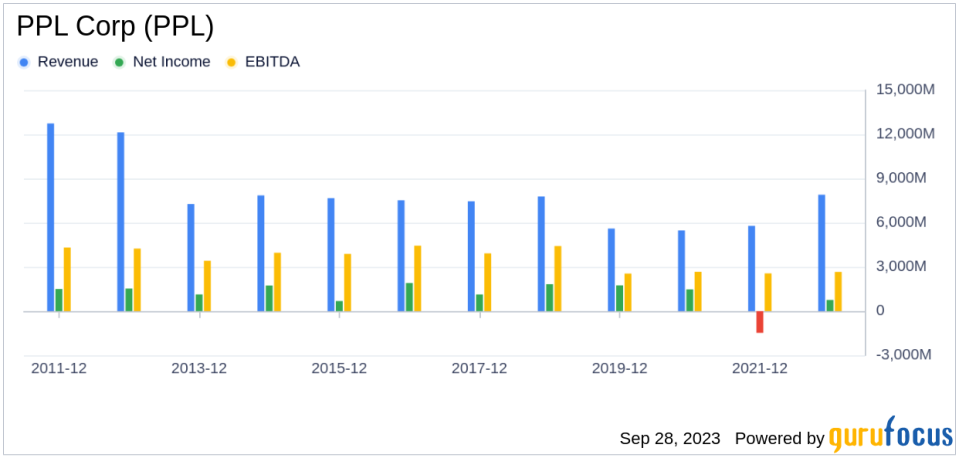
The Bearish Signs: Declining Revenues and Earnings
One of the telltale indicators of a company's potential trouble is a sustained decline in revenues. In the case of PPL, both the revenue per share (evident from the last five years' TTM data: 2019: 10.61; 2020: 5.88; 2021: 7.22; 2022: 8.66; 2023: 11.74; ) and the 5-year revenue growth rate (-3.5%) have been on a consistent downward trajectory. This pattern may point to underlying challenges such as diminishing demand for PPL's products, or escalating competition in its market sector. Either scenario can pose serious risks to the company's future performance, warranting a thorough analysis by investors.
The Red Flag: Sluggish Earnings Growth
The company's earnings picture does not look much brighter. The 3-year EPS without NRI growth rate (-1.3%) is sluggish, and the future 3 to 5-year EPS growth estimate (11%) does not show a promising uptick. These indicators could suggest the company is struggling to translate sales into profits effectively, a critical element of a successful business model.
Despite its low price-to-fair-value ratio, PPL's falling revenues and earnings cast a long shadow over its investment attractiveness. A low price relative to intrinsic value can indeed suggest an investment opportunity, but only if the company's fundamentals are sound or improving. In PPL's case, the declining revenues, EBITDA, and earnings growth suggest that the company's issues may be more than just cyclical fluctuations. Without a clear turnaround strategy, there's a risk that the company's performance could continue to deteriorate, leading to further price declines. In such a scenario, the low price-to-GF-Value ratio may be more indicative of a value trap than a value opportunity.
Conclusion
After a thorough analysis, it is clear that PPL Corp (NYSE:PPL) might be a potential value trap. Despite its seemingly attractive valuation, the company's declining revenues and earnings, coupled with a low Altman Z-score and a high Beneish M-Score, raise serious concerns about its financial health. Therefore, investors should exercise caution and conduct thorough due diligence before making any investment decisions.
GuruFocus Premium members can find stocks with high Altman Z-Score using the Walter Schloss Screen . To find out the high quality companies that may deliver above average returns, check out GuruFocus High Quality Low Capex Screener. Investors can find stocks with good revenue and earnings growth using GuruFocus' Peter Lynch Growth with Low Valuation Screener.
This article first appeared on GuruFocus.
