Is PrimeEnergy Resources Corporation’s (NASDAQ:PNRG) Return On Capital Employed Any Good?

Today we'll evaluate PrimeEnergy Resources Corporation (NASDAQ:PNRG) to determine whether it could have potential as an investment idea. Specifically, we'll consider its Return On Capital Employed (ROCE), since that will give us an insight into how efficiently the business can generate profits from the capital it requires.
First up, we'll look at what ROCE is and how we calculate it. Second, we'll look at its ROCE compared to similar companies. Finally, we'll look at how its current liabilities affect its ROCE.
Return On Capital Employed (ROCE): What is it?
ROCE measures the 'return' (pre-tax profit) a company generates from capital employed in its business. All else being equal, a better business will have a higher ROCE. In brief, it is a useful tool, but it is not without drawbacks. Author Edwin Whiting says to be careful when comparing the ROCE of different businesses, since 'No two businesses are exactly alike.
So, How Do We Calculate ROCE?
Analysts use this formula to calculate return on capital employed:
Return on Capital Employed = Earnings Before Interest and Tax (EBIT) ÷ (Total Assets - Current Liabilities)
Or for PrimeEnergy Resources:
0.073 = US$16m ÷ (US$243m - US$21m) (Based on the trailing twelve months to September 2019.)
Therefore, PrimeEnergy Resources has an ROCE of 7.3%.
Check out our latest analysis for PrimeEnergy Resources
Is PrimeEnergy Resources's ROCE Good?
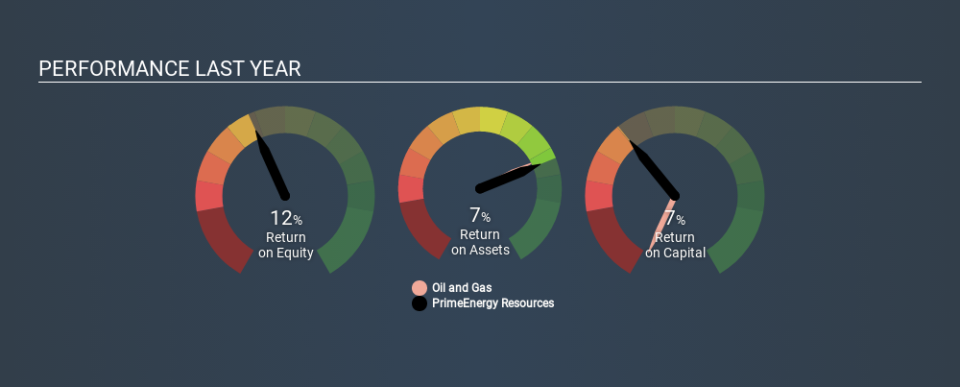
One way to assess ROCE is to compare similar companies. It appears that PrimeEnergy Resources's ROCE is fairly close to the Oil and Gas industry average of 9.0%. Separate from how PrimeEnergy Resources stacks up against its industry, its ROCE in absolute terms is mediocre; relative to the returns on government bonds. It is possible that there are more rewarding investments out there.
PrimeEnergy Resources reported an ROCE of 7.3% -- better than 3 years ago, when the company didn't make a profit. That implies the business has been improving. You can click on the image below to see (in greater detail) how PrimeEnergy Resources's past growth compares to other companies.
When considering this metric, keep in mind that it is backwards looking, and not necessarily predictive. ROCE can be deceptive for cyclical businesses, as returns can look incredible in boom times, and terribly low in downturns. ROCE is only a point-in-time measure. Remember that most companies like PrimeEnergy Resources are cyclical businesses. You can check if PrimeEnergy Resources has cyclical profits by looking at this free graph of past earnings, revenue and cash flow.
How PrimeEnergy Resources's Current Liabilities Impact Its ROCE
Liabilities, such as supplier bills and bank overdrafts, are referred to as current liabilities if they need to be paid within 12 months. The ROCE equation subtracts current liabilities from capital employed, so a company with a lot of current liabilities appears to have less capital employed, and a higher ROCE than otherwise. To check the impact of this, we calculate if a company has high current liabilities relative to its total assets.
PrimeEnergy Resources has total assets of US$243m and current liabilities of US$21m. As a result, its current liabilities are equal to approximately 8.6% of its total assets. PrimeEnergy Resources reports few current liabilities, which have a negligible impact on its unremarkable ROCE.
Our Take On PrimeEnergy Resources's ROCE
Based on this information, PrimeEnergy Resources appears to be a mediocre business. Of course, you might find a fantastic investment by looking at a few good candidates. So take a peek at this free list of companies with modest (or no) debt, trading on a P/E below 20.
I will like PrimeEnergy Resources better if I see some big insider buys. While we wait, check out this free list of growing companies with considerable, recent, insider buying.
If you spot an error that warrants correction, please contact the editor at editorial-team@simplywallst.com. This article by Simply Wall St is general in nature. It does not constitute a recommendation to buy or sell any stock, and does not take account of your objectives, or your financial situation. Simply Wall St has no position in the stocks mentioned.
We aim to bring you long-term focused research analysis driven by fundamental data. Note that our analysis may not factor in the latest price-sensitive company announcements or qualitative material. Thank you for reading.
