The Probability of Another 20%+ Drawdown is Higher Than You Might Expect
This article was originally published on ETFTrends.com.
By Denis Rezendes, Assistant Portfolio Manager and Dave Haviland, Portfolio Manager and Managing Partner, Beaumont Capital Management
At BCM, we believe mitigating large drawdowns can be a crucial component of long-term investment success for investors. As such, we offer investment strategies that seek to provide growth with defensive capabilities. In our attempt to deliver on the latter goal, we’ve spent an inordinate amount of time trying to understand when large drawdowns are more likely to occur. It’s along these lines that the below chart by Jurrien Timmer, Director of Global Macro at Fidelity Investments, stood out to us.
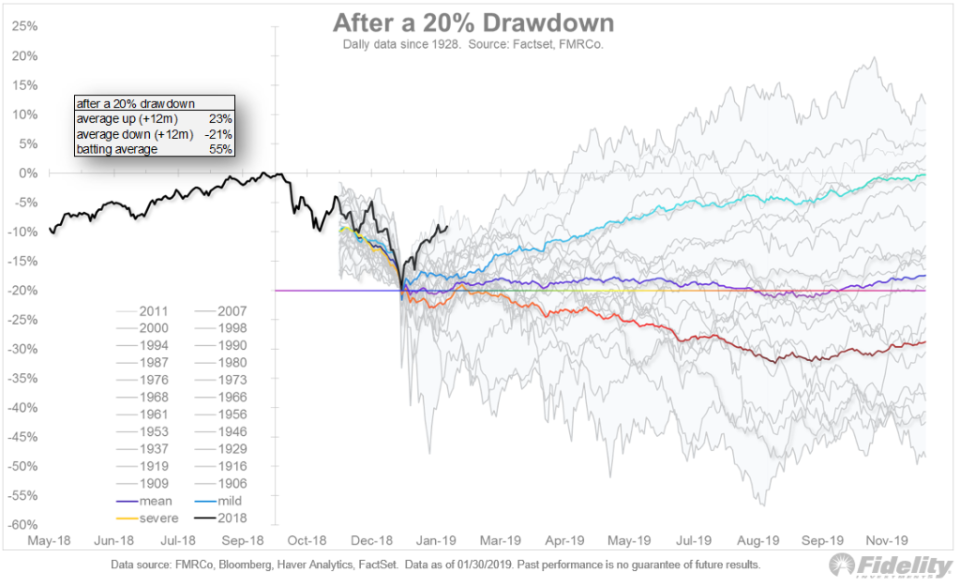
S&P 500® Index Twice as Likely to Fall After 20% Drawdown According to History
This chart complements our short December piece, Anatomy of a Bear Market, which outlines the length, strength and characteristics of all Bear Markets since WWII (ex-1987). It adds important context surrounding the current drawdown, versus all other 20% drawdowns since 1906, but it caught our eye for another more specific reason. In the box in the upper left-hand corner there’s a statistic called “batting average”. What this statistic tells us is that 55% percent of the time, the S&P 500® Index has realized a positive return in the year following a 20% drawdown, or—to invert it—45% of the time, the index realized a negative return in the year following a 20% drawdown. Additionally, the average return during these negative occurrences was -21% (in addition to the 20% already lost)!
To provide some context to these numbers, we studied the S&P 500 over a similar time period as the chart when daily data was available, from 1/3/1929 to 1/30/2019. Regardless of the type of market, we found that roughly 25% of the S&P 500’s 1-year returns were negative and that when the index realized a negative return it fell, on average, 14.8%. Although it may seem counterintuitive, after already having experienced a 20% drawdown, the S&P 500 was almost twice as likely to fall over the next year and when it did fall, the average return was nearly 7% worse.
Avoiding Large Drawdowns
This is obviously a simplistic analysis, but it’s a good illustration of what we’re trying to accomplish. Although we won’t be right on every occasion, we believe it is possible to identify the times when the probability that we’ll sustain a large loss is higher. It is our belief that if we reduce or eliminate market exposure during these times it will provide a satisfactory result over a full market cycle (including a bull and a bear market). To use an analogy, if a coin flip determined the success of your investments over the next year, would you accept those odds?
This article was contributed by Denis Rezendes and Dave Haviland, Portfolio Manager at Beaumont Capital Management, a participant in the ETF Strategist Channel.
For more insights like these, visit BCM’s blog at blog.investbcm.com
Disclosures:
Copyright © 2019 Beaumont Financial Partners, LLC DBA Beaumont Capital Management (BCM). All rights reserved.
The views and opinions expressed throughout this paper are those of the author as of February 2019. The opinions and outlooks may change over time with changing market conditions or other relevant variables.
The information presented in this report is based on data obtained from third party sources. Although it is believed to be accurate, no representation or warranty is made as to its accuracy or completeness.
This material is provided for informational purposes only and does not in any sense constitute a solicitation or offer for the purchase or sale of securities nor should it be construed as investment advice. Past performance is no guarantee of future results. An investment cannot be made directly in an index.
“S&P 500 ®” is a registered trademark of Standard & Poor’s, Inc., a division of S&P Global Inc.
As with all investments, there are associated inherent risks including loss of principal. Stock markets, especially foreign markets, are volatile and can decline significantly in response to adverse issuer, political, regulatory, market, or economic developments. Sector investments concentrate in a particular industry, and the investments’ performance could depend heavily on the performance of that industry and be more volatile than the performance of less concentrated investment options. Foreign securities are subject to interest rate, currency exchange rate, economic, and political risks, all of which are magnified in emerging markets. The risks are particularly significant for ETFs that focus on a single country or region. The ETF may have additional volatility because it may be comprised significantly of assets in securities of a small number of individual issuers.
POPULAR ARTICLES AND RESOURCES FROM ETFTRENDS.COM
