Prosperity Bancshares (PB) Q4 Earnings Beat, Revenues Fall Y/Y
Prosperity Bancshares Inc.’s PB fourth-quarter 2023 adjusted earnings per share of $1.19 beat the Zacks Consensus Estimate by a penny. However, the bottom line decreased 21.2% from the prior-year quarter.
Results benefited from nil provisions during the quarter. Nevertheless, a fall in both net interest income (NII) and non-interest income, along with rising expenses, was a major headwind.
The results excluded the charges related to FDIC special assessment and merger. After considering these charges, net income available to common shareholders was $95.5 million, down 30.8% year over year.
In 2023, adjusted earnings per share were $4.97, which declined 13.3% from the previous year. The figure was in line with the Zacks Consensus Estimate. Net income available to common shareholders (GAAP) was $419.3 million, down 20.1% year over year.
Revenues Fall & Expenses Increase
Quarterly total revenues were $273.6 million, which declined 6.9% from the prior-year quarter. The top line missed the Zacks Consensus Estimate of $279.3 million.
In 2023, total revenues were $1.11 billion, down 3.5% year over year. The top line missed the Zacks Consensus Estimate of $1.12 billion.
NII was $237 million, down 7.5% year over year. Net interest margin (NIM), on a tax-equivalent basis, decreased 30 basis points to 2.75%. Our estimates for NII and NIM were pegged at $240.9 million and 2.75%, respectively.
Non-interest income was $36.6 million, which declined 3.1% from the previous year quarter. Our estimate for the metric was pinned at $38.2 million.
Non-interest expenses increased 27.6% to $152.2 million. The increase was mainly attributed to the charges related to the FDIC special assessment and extra expenses tied to the merger. Excluding these one-time charges, adjusted expenses were $132 million, up 10.9% year over year. Our estimate for non-interest expenses was $135.9 million.
The adjusted efficiency ratio was 48.23%, which increased from 40.87% in the prior-year quarter. A rise in the efficiency ratio indicates lower profitability.
As of Dec 31, 2023, total loans were $21.2 billion, which declined 1.2% from the previous quarter. Total deposits were $27.2 billion, down marginally.
Credit Quality Deteriorates
The company recorded nil provision for credit losses during the reported quarter as well as for the fourth quarter of 2022.
As of Dec 31, 2023, total non-performing assets were $72.7 million, which rose from $27.5 million in the prior-year quarter.
Net charge-offs were $19.1 million, which increased from $0.6 million in the year-ago period. The ratio of allowance for credit losses to total loans was 1.57%, which rose from 1.49% in the prior-year quarter.
Capital & Profitability Ratios Deteriorate
As of Dec 31, 2023, the Tier-1 risk-based capital ratio was 15.54%, which fell from 15.88% recorded in the prior-year quarter. The total risk-based capital ratio was 16.56%, which increased from 16.51% as of Dec 31, 2022.
At the end of the fourth quarter, the annualized return on average assets was 0.98%, which declined from 1.47% at the end of the prior-year quarter. Also, the annualized return on average common equity was 5.39%, which fell from 8.26%.
Share Repurchase Update
During the fourth quarter, Prosperity Bancshares did not repurchase any shares. During 2023, the company bought approximately $1.21 million shares at an average weighted price of $59.88.
Our Take
Prosperity Bancshares' emphasis on strategic acquisitions is expected to contribute to the company’s long-term financial strength. However, lower revenues, along with elevated expenses and reduced loan and deposit balances, remain a near-term concern.
Prosperity Bancshares, Inc. Price, Consensus and EPS Surprise
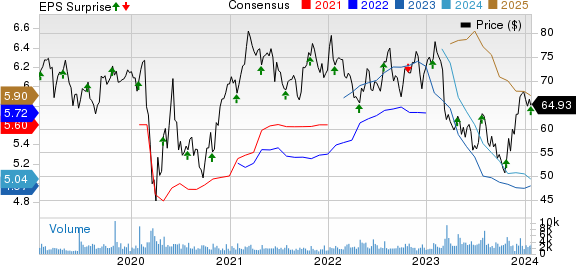
Prosperity Bancshares, Inc. price-consensus-eps-surprise-chart | Prosperity Bancshares, Inc. Quote
PB currently carries a Zacks Rank #3 (Hold). You can see the complete list of today’s Zacks #1 Rank (Strong Buy) stocks here.
Performance of Other Banks
Hancock Whitney Corp.’s HWC fourth-quarter 2023 adjusted earnings per share of $1.26 beat the Zacks Consensus Estimate of $1.08. Adjusted earnings per share, however, compared unfavorably with $1.65 earned in the year-ago quarter.
HWC’s results were impacted by a decline in both NII and non-interest income. Further, a slight decrease in loan balances and an increase in expenses and provisions acted as spoilsports.
WaFd, Inc.’s WAFD first-quarter fiscal 2024 (ended Dec 31) earnings of 85 cents per share surpassed the Zacks Consensus Estimate of 72 cents. However, the bottom line declined 26.7% year over year.
WAFD’s results primarily benefited from the rise in other income and steady loan balance. In the reported quarter, the company did not record any provision for credit losses. However, a fall in NII and an increase in other expenses acted as spoilsports.
Want the latest recommendations from Zacks Investment Research? Today, you can download 7 Best Stocks for the Next 30 Days. Click to get this free report
WaFd, Inc. (WAFD) : Free Stock Analysis Report
Prosperity Bancshares, Inc. (PB) : Free Stock Analysis Report
Hancock Whitney Corporation (HWC) : Free Stock Analysis Report
