Can Provident Financial Services Inc’s (NYSE:PFS) ROE Continue To Surpass The Industry Average?

This article is intended for those of you who are at the beginning of your investing journey and want to begin learning the link between Provident Financial Services Inc (NYSE:PFS)’s return fundamentals and stock market performance.
With an ROE of 7.54%, Provident Financial Services Inc (NYSE:PFS) outpaced its own industry which delivered a less exciting 5.71% over the past year. Superficially, this looks great since we know that PFS has generated big profits with little equity capital; however, ROE doesn’t tell us how much PFS has borrowed in debt. In this article, we’ll closely examine some factors like financial leverage to evaluate the sustainability of PFS’s ROE. See our latest analysis for Provident Financial Services
Breaking down Return on Equity
Return on Equity (ROE) weighs Provident Financial Services’s profit against the level of its shareholders’ equity. It essentially shows how much the company can generate in earnings given the amount of equity it has raised. In most cases, a higher ROE is preferred; however, there are many other factors we must consider prior to making any investment decisions.
Return on Equity = Net Profit ÷ Shareholders Equity
ROE is measured against cost of equity in order to determine the efficiency of Provident Financial Services’s equity capital deployed. Its cost of equity is 9.60%. Given a discrepancy of -2.06% between return and cost, this indicated that Provident Financial Services may be paying more for its capital than what it’s generating in return. ROE can be broken down into three different ratios: net profit margin, asset turnover, and financial leverage. This is called the Dupont Formula:
Dupont Formula
ROE = profit margin × asset turnover × financial leverage
ROE = (annual net profit ÷ sales) × (sales ÷ assets) × (assets ÷ shareholders’ equity)
ROE = annual net profit ÷ shareholders’ equity

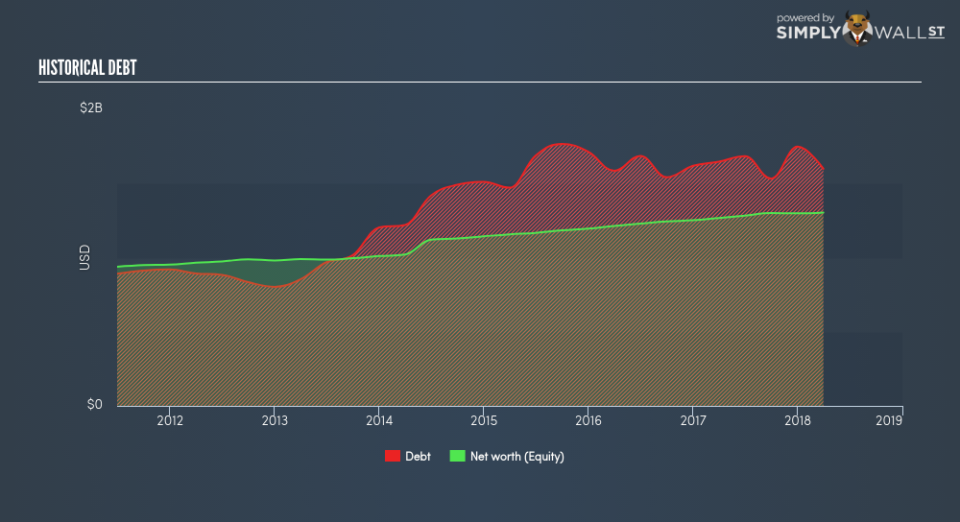
Essentially, profit margin shows how much money the company makes after paying for all its expenses. Asset turnover reveals how much revenue can be generated from Provident Financial Services’s asset base. The most interesting ratio, and reflective of sustainability of its ROE, is financial leverage. Since ROE can be artificially increased through excessive borrowing, we should check Provident Financial Services’s historic debt-to-equity ratio. The debt-to-equity ratio currently stands at a balanced 122.59%, meaning the above-average ROE is due to its capacity to produce profit growth without a huge debt burden.
Next Steps:
ROE is a simple yet informative ratio, illustrating the various components that each measure the quality of the overall stock. Provident Financial Services’s above-industry ROE is noteworthy, but it was not high enough to cover its own cost of equity. Although ROE can be a useful metric, it is only a small part of diligent research.
For Provident Financial Services, I’ve compiled three fundamental factors you should further research:
Financial Health: Does it have a healthy balance sheet? Take a look at our free balance sheet analysis with six simple checks on key factors like leverage and risk.
Valuation: What is Provident Financial Services worth today? Is the stock undervalued, even when its growth outlook is factored into its intrinsic value? The intrinsic value infographic in our free research report helps visualize whether Provident Financial Services is currently mispriced by the market.
Other High-Growth Alternatives : Are there other high-growth stocks you could be holding instead of Provident Financial Services? Explore our interactive list of stocks with large growth potential to get an idea of what else is out there you may be missing!
To help readers see pass the short term volatility of the financial market, we aim to bring you a long-term focused research analysis purely driven by fundamental data. Note that our analysis does not factor in the latest price sensitive company announcements.
The author is an independent contributor and at the time of publication had no position in the stocks mentioned.
