Proxama Plc (AIM:PROX): Does 2.2% EPS Drop In A Year Reflect The Long-Term Trend?

Analyzing Proxama Plc’s (AIM:PROX) track record of past performance is a valuable exercise for investors. It enables us to reflect on whether or not the company has met expectations, which is a powerful signal for future performance. Today I will assess PROX’s recent performance announced on 30 June 2017 and compare these figures to its long-term trend and industry movements. See our latest analysis for PROX
How Did PROX’s Recent Performance Stack Up Against Its Past?
For the most up-to-date info, I use data from the most recent 12 months, which either annualizes the most recent 6-month earnings update, or in some cases, the most recent annual report is already the latest available financial data. This technique allows me to examine various companies in a uniform manner using the most relevant data points. For Proxama, the latest twelve-month earnings -£4.7M, which, against last year’s level, has become more negative. Given that these values are fairly myopic, I’ve determined an annualized five-year value for PROX’s earnings, which stands at -£4.4M. This doesn’t seem to paint a better picture, since earnings seem to have gradually been getting more and more negative over time.
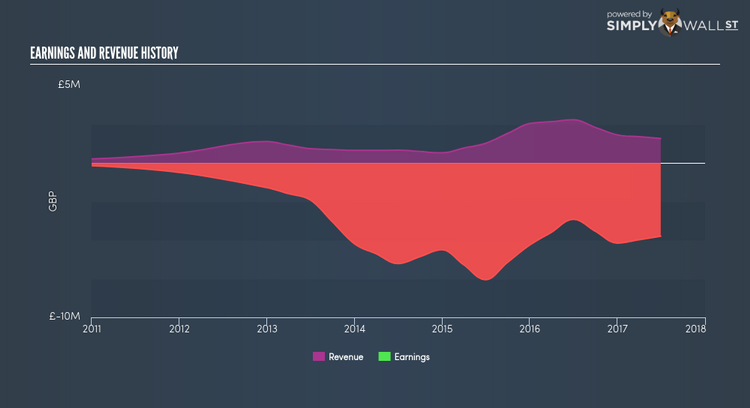
Additionally, we can evaluate Proxama’s loss by looking at what has been happening in the industry on top of within the company. Firstly, I want to briefly look into the line items. Revenue growth over past few years has grew by 22.28%, indicating that Proxama is in a high-growth phase with expenses shooting ahead of elevated top-line growth rates. Eyeballing growth from a sector-level, the UK software industry has been growing, albeit, at a unexciting single-digit rate of 6.46% over the previous year, and 4.23% over the past five. This shows that whatever uplift the industry is benefiting from, Proxama has not been able to gain as much as its average peer.
What does this mean?
Proxama’s track record can be a valuable insight into its earnings performance, but it certainly doesn’t tell the whole story. With companies that are currently loss-making, it is always difficult to forecast what will happen in the future and when. The most insightful step is to examine company-specific issues Proxama may be facing and whether management guidance has regularly been met in the past. You should continue to research Proxama to get a more holistic view of the stock by looking at:
1. Financial Health: Is PROX’s operations financially sustainable? Balance sheets can be hard to analyze, which is why we’ve done it for you. Check out our financial health checks here.
2. Other High-Performing Stocks: Are there other stocks that provide better prospects with proven track records? Explore our free list of these great stocks here.
NB: Figures in this article are calculated using data from the last twelve months, which refer to the 12-month period ending on the last date of the month the financial statement is dated. This may not be consistent with full year annual report figures.
To help readers see pass the short term volatility of the financial market, we aim to bring you a long-term focused research analysis purely driven by fundamental data. Note that our analysis does not factor in the latest price sensitive company announcements.
The author is an independent contributor and at the time of publication had no position in the stocks mentioned.
