Puma Biotech (PBYI) Q1 Earnings Beat, Nerlynx Sales Rise Y/Y
Puma Biotechnology PBYI reported first-quarter 2023 earnings of 9 cents per share, in contrast to the Zacks Consensus Estimate of a loss of 2 cents. In the year-ago quarter, the company had reported a loss of 1 cent per share.
The above-adjusted loss excludes the impact of stock-based compensation expense, including which, reported earnings per share were 3 cents per share against a loss of 8 cents per share in the year-ago quarter.
In the first quarter, total revenues were $52.8 million, which beat the Zacks Consensus Estimate of $49.7 million as well as our model estimate of $49.5 million.
Revenues were up 15.5% year over year. Total revenues comprised net product sales of Nerlynx (neratinib), Puma Biotech's only marketed drug in the United States, and license fees and royalty revenues from PBYI’s sub-licensees. Nerlynx is indicated for treating early-stage HER2-positive breast cancer.
Puma Biotech’s shares were up around 7% in after-hours trading on May 4 in response to the better-than-expected earnings performance. Puma Biotech’s shares have risen 6.5% in the past year against the industry’s 8.8% decline.
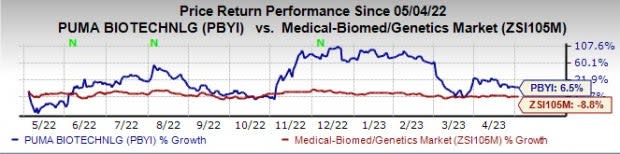
Image Source: Zacks Investment Research
Quarter in Detail
Product revenues from Nerlynx were $46.8 million in the quarter, up 15% year over year. Nerlynx’s product sales were slightly better than the guidance range of $43-$46 million. However, product revenues declined 12.8% sequentially due to an inventory drawdown from distributors.
Royalty revenues were $6 million, up 20% from the year-ago quarter. However, royalty revenues declined 50% sequentially due to the unfavorable timing of shipments to the company’s partner in China.
Puma Biotech did not record any license revenues in the first quarter.
Total operating costs in the quarter were $48.4 million, up 4.3% year over year. Selling, general and administrative expenses were up 10.3% year over year to $22.5 million due to higher salary and headcount costs.
Adjusted research and development expenses were $12.7 million in the quarter, down 16.4% year over year. This was primarily due to lower expense for clinical studies.
Cash, cash equivalents and marketable securities were $71.0 million as on Mar 31, 2023 compared with $81.1 million as on Dec 31, 2022.
2023 Guidance
Puma Biotech maintained its previously issued guidance for 2023. It expects Nerlynx’s product sales in the range of $205-$210 million.
The company expects royalty revenues to be in the $25-$30 million range. Net income is expected to be in the range of $20-$24 million.
Total operating expenses are anticipated to decline in 2023 from the 2022 level. SG&A is expected to decline approximately 1-3% and R&D is expected to increase 6-8% year over year.
In the second quarter, Nerlynx’s product sales are expected to be in the range of $47-$50 million while royalty revenues are expected to be $2-$3 million. Net income is expected to be in the range of $0-$1.5 million.
Pipeline Update
In September, Puma Biotech in-licensed global development and commercialization rights to alisertib, an aurora kinase A inhibitor, from Japan’s Takeda.
Puma believes alisertib has the potential in HER2-positive, HER2-negative breast cancer, triple-negative breast cancer and small cell lung cancer, based on the results of the already completed mid-stage studies. In the second quarter, Puma expects to report biomarker data from a phase II study evaluating alisertib plus paclitaxel versus paclitaxel alone in HER2-positive, HER2-negative breast cancer. Puma also plans to conduct a meeting with the FDA to discuss the registration pathway for alisertib in SCLC in the second quarter and plans to begin later-stage clinical studies in SCLC in the fourth quarter.
Puma also plans to conduct a meeting with the FDA to discuss the registration pathway for alisertib in HER2-positive, HER2-negative breast cancer in the fourth quarter.
Zacks Rank & Stocks to Consider
Puma Biotech currently has a Zacks Rank #3 (Hold).
Puma Biotechnology, Inc. Price, Consensus and EPS Surprise
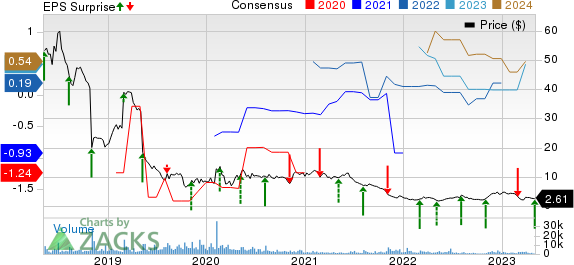
Puma Biotechnology, Inc. price-consensus-eps-surprise-chart | Puma Biotechnology, Inc. Quote
Some better-ranked stocks in the same sector are Ocuphire Pharma OCUP, Allogene Therapeutics ALLO and Arcus Biosciences RCUS. While Ocuphire Pharma sports a Zacks Rank #1 (Strong Buy), Allogene Therapeutics and Arcus Biosciences both have a Zacks Rank #2 (Buy), at present. You can see the complete list of today’s Zacks #1 Rank (Strong Buy) stocks here.
Loss per share estimates for Ocuphire Pharma have narrowed from 29 cents to 24 cents for 2023 and from 86 cents to 81 cents for 2024 in the past 60 days. Shares of OCUP have surged 161.6% in the past year. Earnings of Ocuphire beat estimates in three of the last four quarters and missed the mark in one, the average surprise being 23.85%.
Loss per share estimates for Allogene have narrowed from $2.56 to $2.44 for 2023 and from $2.53 per share to $2.46 per share for 2024 in the past 60 days. Shares of ALLO have plunged 31.6% in the past year. Earnings of Allogene beat estimates in three of the last four quarters, the average surprise being 5.08%
Loss per share estimates for Arcus Biosciences have narrowed from $4.52 to $4.42 for 2023 and from $3.51 to $3.33 for 2024 in the past 60 days. Shares of RCUS have plunged 22.5% in the past year. Earnings of Arcus Biosciences beat estimates in two of the last four quarters, met the mark in one and missed in another, the average negative surprise being 48.83%.
Want the latest recommendations from Zacks Investment Research? Today, you can download 7 Best Stocks for the Next 30 Days. Click to get this free report
Puma Biotechnology, Inc. (PBYI) : Free Stock Analysis Report
Arcus Biosciences, Inc. (RCUS) : Free Stock Analysis Report
Allogene Therapeutics, Inc. (ALLO) : Free Stock Analysis Report
Ocuphire Pharma, Inc. (OCUP) : Free Stock Analysis Report
