Qorvo (QRVO): A Balanced Examination of Its Market Value
Qorvo Inc (NASDAQ:QRVO) experienced a daily loss of -5.81%, with a 3-month gain of 0.19%. Despite a Loss Per Share of 0.17, the pertinent question arises: is the stock Fairly Valued? This article aims to address this question by providing a comprehensive valuation analysis of Qorvo's stock. We invite you to delve into the following assessment for a deeper understanding.
An Overview of Qorvo Inc (NASDAQ:QRVO)
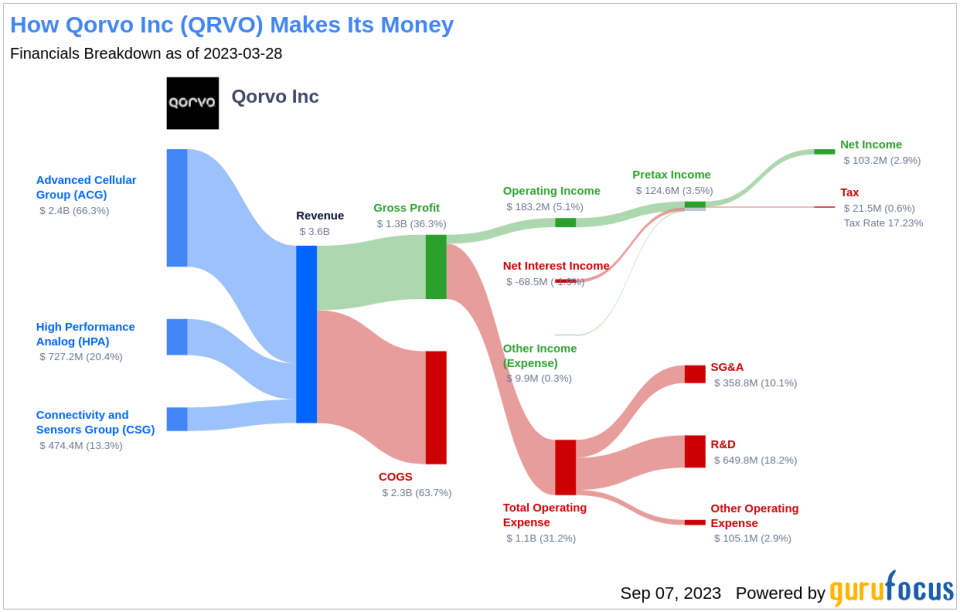
Qorvo, the combined entity of RF Micro Devices and TriQuint Semiconductor since January 2015, specializes in radio frequency filters, power amplifiers, and front-end modules. These components are integral to many of the world's most advanced smartphones. Furthermore, Qorvo offers a range of products for various nonsmartphone end markets, including wireless base stations, cable TV and networking equipment, and infrastructure and military applications.
Understanding GF Value
The GF Value is a proprietary measure that represents the current intrinsic value of a stock. This value is derived from three key factors: historical multiples (PE Ratio, PS Ratio, PB Ratio and Price-to-Free-Cash-Flow) that the stock has traded at, GuruFocus adjustment factor based on the company's past returns and growth, and future estimates of the business performance.
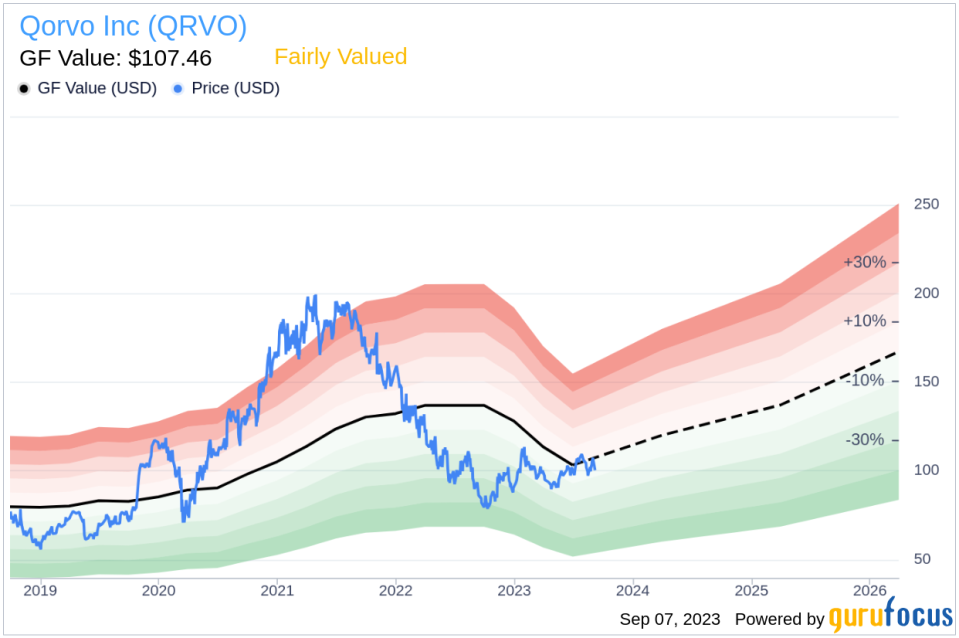
According to our valuation method, Qorvo (NASDAQ:QRVO) appears to be fairly valued at its current price of $ 100.07 per share. This estimation is based on historical multiples, an internal adjustment based on the company's past business growth, and analyst estimates of future business performance. If the share price is significantly above the GF Value Line, the stock may be overvalued and have poor future returns. Conversely, if the share price is significantly below the GF Value calculation, the stock may be undervalued and have higher future returns.
Given that Qorvo is fairly valued, the long-term return of its stock is likely to be close to the rate of its business growth.
Financial Strength of Qorvo (NASDAQ:QRVO)
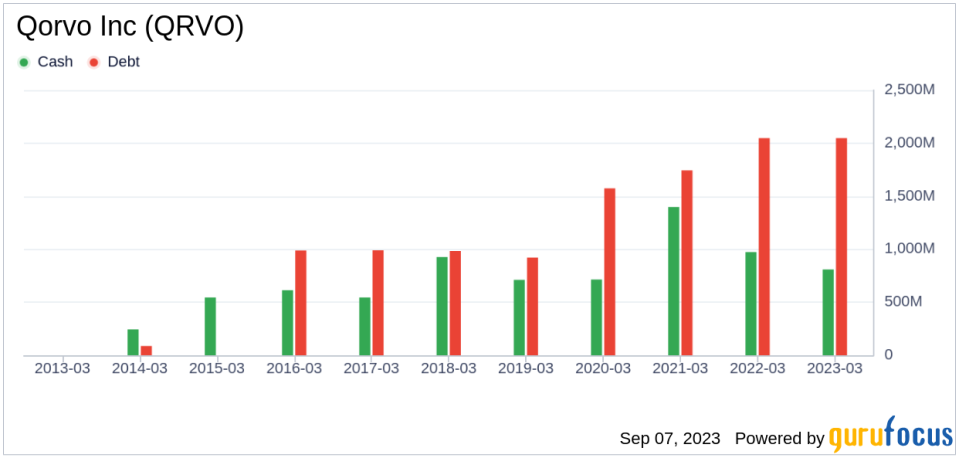
Before investing in a company's stock, it's crucial to check the company's financial strength. Investing in companies with poor financial strength carries a higher risk of permanent loss. The cash-to-debt ratio and interest coverage offer valuable insights into a company's financial strength. Qorvo's cash-to-debt ratio is 0.36, ranking worse than 82.35% of 895 companies in the Semiconductors industry. Overall, Qorvo's financial strength is rated 6 out of 10, indicating a fair financial position.
Profitability and Growth of Qorvo
Companies that have been consistently profitable over the long term offer less risk for investors. Higher profit margins usually indicate a better investment compared to a company with lower profit margins. Qorvo has been profitable 7 over the past 10 years. Over the past twelve months, the company had a revenue of $3.20 billion and a Loss Per Share of $0.17. Its operating margin is 1.04%, which ranks worse than 66.42% of 938 companies in the Semiconductors industry. Overall, Qorvo's profitability is ranked 7 out of 10, indicating fair profitability.
One of the most important factors in the valuation of a company is its growth. Companies that grow faster create more value for shareholders, especially if that growth is profitable. The average annual revenue growth of Qorvo is 8.5%, which ranks worse than 58.98% of 863 companies in the Semiconductors industry. The 3-year average EBITDA growth is -12.7%, ranking worse than 87.08% of 766 companies in the Semiconductors industry.
ROIC vs WACC
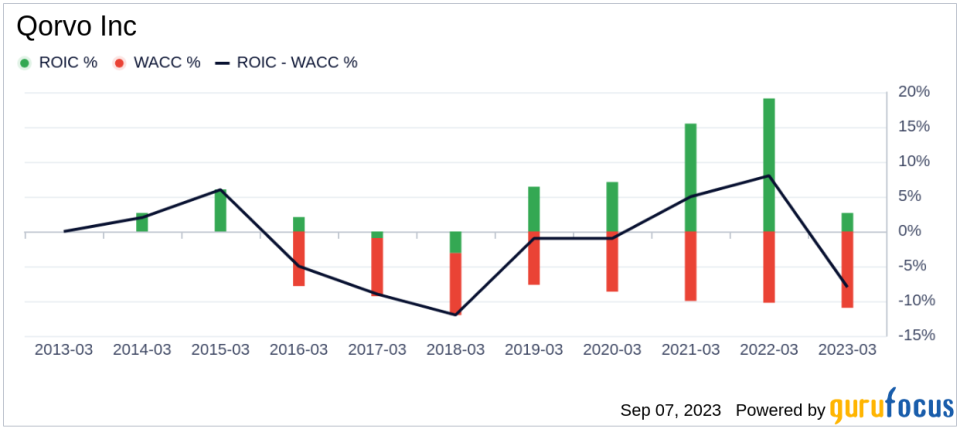
Comparing a company's return on invested capital (ROIC) and the weighted cost of capital (WACC) provides another perspective on its profitability. ROIC measures how well a company generates cash flow relative to the capital it has invested in its business. WACC is the rate that a company is expected to pay on average to all its security holders to finance its assets. Ideally, ROIC should be higher than the WACC. For the past 12 months, Qorvo's ROIC is 0.83, and its WACC is 11.15.
Conclusion
Overall, Qorvo's stock appears to be fairly valued. The company's financial condition is fair, and its profitability is fair. Its growth ranks worse than 87.08% of 766 companies in the Semiconductors industry. To learn more about Qorvo stock, you can check out its 30-Year Financials here.
To find out the high-quality companies that may deliver above-average returns, please check out GuruFocus High Quality Low Capex Screener.
This article first appeared on GuruFocus.
