Qorvo (QRVO): A Closer Look at Its Modest Undervaluation
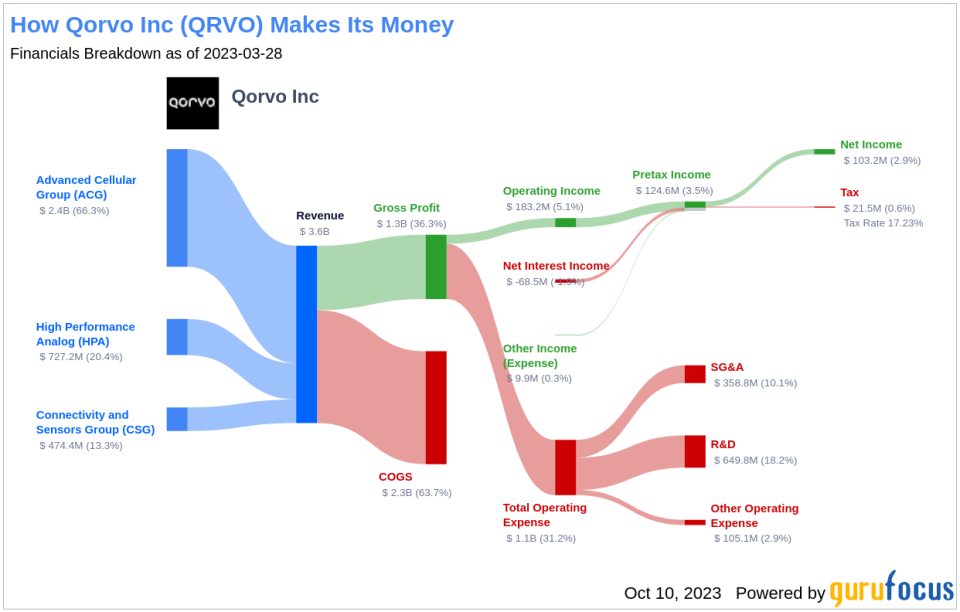
Qorvo Inc (NASDAQ:QRVO), a leading company specializing in radio frequency filters, power amplifiers, and front-end modules, has seen a -2.15% daily change and a -10.98% loss over the past three months. Despite these figures and a reported Loss Per Share of 0.17, we aim to explore the question: is Qorvo's stock modestly undervalued? This article presents an in-depth valuation analysis of Qorvo, providing valuable insights for potential investors.
Company Overview
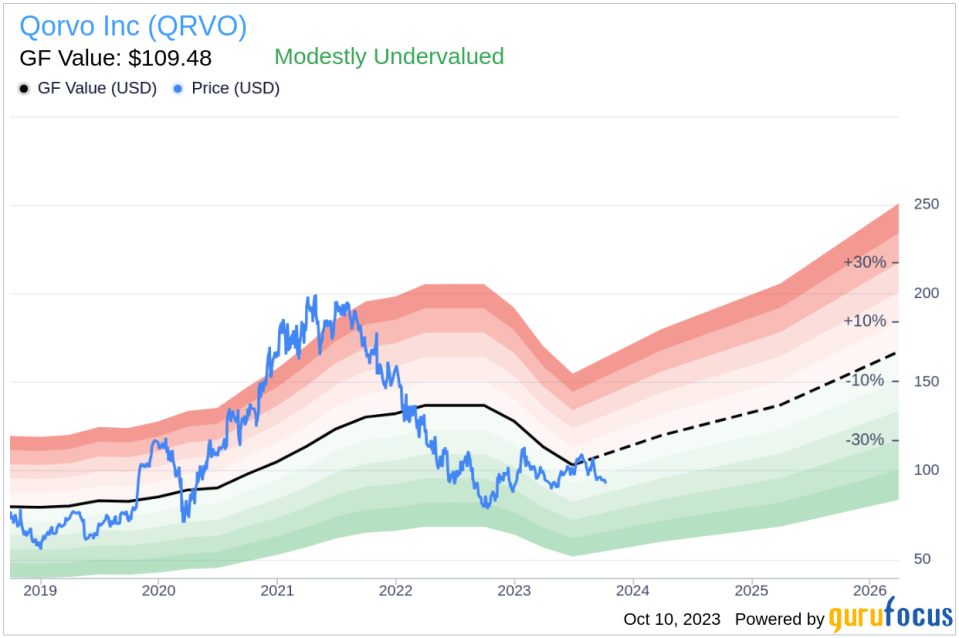
Qorvo Inc, the combined entity of RF Micro Devices and TriQuint Semiconductor since January 2015, specializes in creating components for some of the world's most advanced smartphones. The company also offers a suite of products for various non-smartphone markets, including wireless base stations, cable TV and networking equipment, and infrastructure and military applications. With a current stock price of $92.86 and a GF Value of $109.48, Qorvo (NASDAQ:QRVO) appears to be modestly undervalued.
Understanding GF Value
The GF Value is a proprietary measure that represents the current intrinsic value of a stock. It is calculated based on historical trading multiples, a GuruFocus adjustment factor based on past returns and growth, and future business performance estimates. The GF Value Line on our summary page provides an overview of the fair value at which the stock should ideally be traded.
According to the GF Value, Qorvo (NASDAQ:QRVO) appears to be modestly undervalued. This conclusion is based on historical multiples, an internal adjustment based on Qorvo's past business growth, and analyst estimates of future business performance. A stock price significantly above the GF Value Line may indicate overvaluation and poor future returns. Conversely, a stock price significantly below the GF Value Line may suggest undervaluation and higher future returns.
Given Qorvo's modest undervaluation, the long-term return of its stock is likely to be higher than its business growth.
Link: These companies may deliver higher future returns at reduced risk.
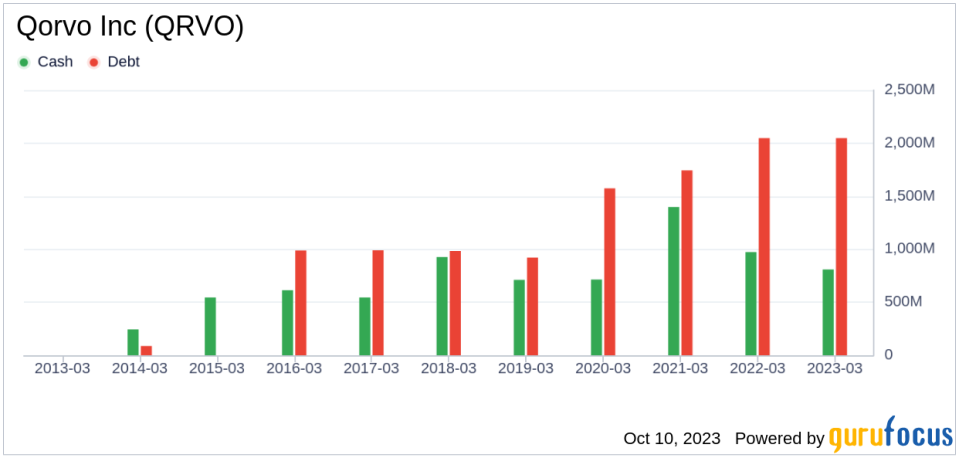
Financial Strength
Before investing in a company, it's crucial to assess its financial strength. Companies with poor financial strength pose a higher risk of permanent loss. Qorvo's cash-to-debt ratio of 0.36 is lower than 82.63% of 904 companies in the Semiconductors industry, indicating fair financial strength with a score of 6 out of 10.
Profitability and Growth
Investing in profitable companies carries less risk, especially those with consistent profitability over the long term. Qorvo has been profitable for 7 out of the past 10 years. However, with an operating margin of 1.04%, it ranks worse than 66.88% of 954 companies in the Semiconductors industry, resulting in a fair profitability rank.
Growth is a critical factor in a company's valuation. Qorvo's 3-year average revenue growth rate is worse than 58.92% of 874 companies in the Semiconductors industry. Its 3-year average EBITDA growth rate is -12.7%, ranking worse than 86.86% of companies in the industry.
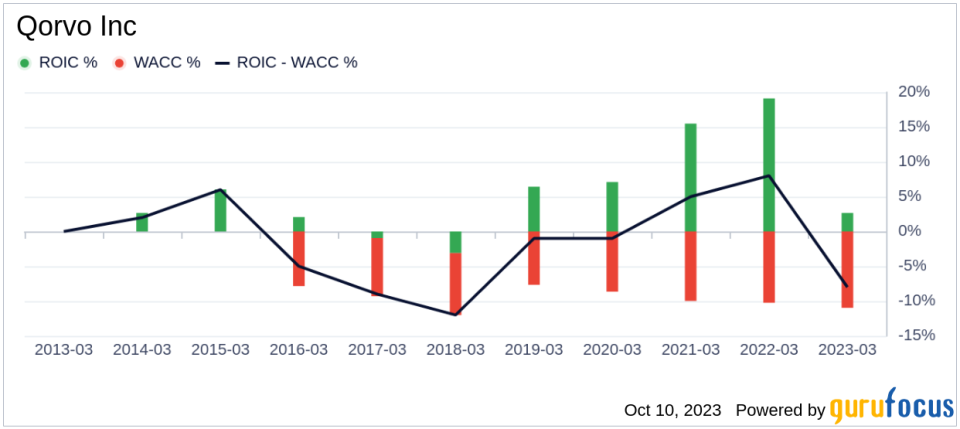
ROIC vs WACC
Comparing a company's return on invested capital (ROIC) and the weighted average cost of capital (WACC) can provide insights into its profitability. For the past 12 months, Qorvo's ROIC is 0.83, and its WACC is 11.35.
Conclusion
In summary, Qorvo's stock shows signs of being modestly undervalued. The company's financial condition and profitability are fair, but its growth ranks worse than 86.86% of 776 companies in the Semiconductors industry. To learn more about Qorvo's stock, you can check out its 30-Year Financials here.
For high-quality companies that may deliver above-average returns, please check out the GuruFocus High Quality Low Capex Screener.
This article, generated by GuruFocus, is designed to provide general insights and is not tailored financial advice. Our commentary is rooted in historical data and analyst projections, utilizing an impartial methodology, and is not intended to serve as specific investment guidance. It does not formulate a recommendation to purchase or divest any stock and does not consider individual investment objectives or financial circumstances. Our objective is to deliver long-term, fundamental data-driven analysis. Be aware that our analysis might not incorporate the most recent, price-sensitive company announcements or qualitative information. GuruFocus holds no position in the stocks mentioned herein.
This article first appeared on GuruFocus.
