Is R1 RCM Inc.'s (NASDAQ:RCM) Stock Price Struggling As A Result Of Its Mixed Financials?
R1 RCM (NASDAQ:RCM) has had a rough three months with its share price down 47%. We, however decided to study the company's financials to determine if they have got anything to do with the price decline. Long-term fundamentals are usually what drive market outcomes, so it's worth paying close attention. In this article, we decided to focus on R1 RCM's ROE.
ROE or return on equity is a useful tool to assess how effectively a company can generate returns on the investment it received from its shareholders. In simpler terms, it measures the profitability of a company in relation to shareholder's equity.
View our latest analysis for R1 RCM
How Do You Calculate Return On Equity?
Return on equity can be calculated by using the formula:
Return on Equity = Net Profit (from continuing operations) ÷ Shareholders' Equity
So, based on the above formula, the ROE for R1 RCM is:
0.6% = US$16m ÷ US$2.8b (Based on the trailing twelve months to September 2022).
The 'return' is the yearly profit. Another way to think of that is that for every $1 worth of equity, the company was able to earn $0.01 in profit.
What Is The Relationship Between ROE And Earnings Growth?
So far, we've learned that ROE is a measure of a company's profitability. Based on how much of its profits the company chooses to reinvest or "retain", we are then able to evaluate a company's future ability to generate profits. Assuming all else is equal, companies that have both a higher return on equity and higher profit retention are usually the ones that have a higher growth rate when compared to companies that don't have the same features.
R1 RCM's Earnings Growth And 0.6% ROE
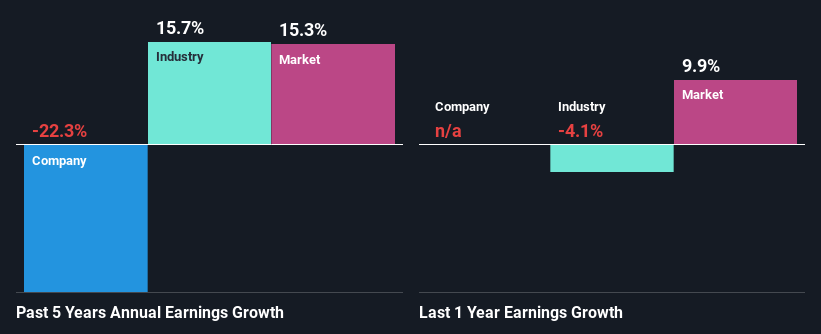
It is hard to argue that R1 RCM's ROE is much good in and of itself. Even when compared to the industry average of 13%, the ROE figure is pretty disappointing. Therefore, it might not be wrong to say that the five year net income decline of 22% seen by R1 RCM was possibly a result of it having a lower ROE. However, there could also be other factors causing the earnings to decline. For instance, the company has a very high payout ratio, or is faced with competitive pressures.
So, as a next step, we compared R1 RCM's performance against the industry and were disappointed to discover that while the company has been shrinking its earnings, the industry has been growing its earnings at a rate of 16% in the same period.
The basis for attaching value to a company is, to a great extent, tied to its earnings growth. The investor should try to establish if the expected growth or decline in earnings, whichever the case may be, is priced in. This then helps them determine if the stock is placed for a bright or bleak future. If you're wondering about R1 RCM's's valuation, check out this gauge of its price-to-earnings ratio, as compared to its industry.
Is R1 RCM Using Its Retained Earnings Effectively?
Because R1 RCM doesn't pay any dividends, we infer that it is retaining all of its profits, which is rather perplexing when you consider the fact that there is no earnings growth to show for it. It looks like there might be some other reasons to explain the lack in that respect. For example, the business could be in decline.
Conclusion
Overall, we have mixed feelings about R1 RCM. Even though it appears to be retaining most of its profits, given the low ROE, investors may not be benefitting from all that reinvestment after all. The low earnings growth suggests our theory correct. That being so, the latest industry analyst forecasts show that the analysts are expecting to see a huge improvement in the company's earnings growth rate. To know more about the latest analysts predictions for the company, check out this visualization of analyst forecasts for the company.
Have feedback on this article? Concerned about the content? Get in touch with us directly. Alternatively, email editorial-team (at) simplywallst.com.
This article by Simply Wall St is general in nature. We provide commentary based on historical data and analyst forecasts only using an unbiased methodology and our articles are not intended to be financial advice. It does not constitute a recommendation to buy or sell any stock, and does not take account of your objectives, or your financial situation. We aim to bring you long-term focused analysis driven by fundamental data. Note that our analysis may not factor in the latest price-sensitive company announcements or qualitative material. Simply Wall St has no position in any stocks mentioned.
Join A Paid User Research Session
You’ll receive a US$30 Amazon Gift card for 1 hour of your time while helping us build better investing tools for the individual investors like yourself. Sign up here
