Ranpak Holdings Corp.'s (NYSE:PACK) Intrinsic Value Is Potentially 18% Below Its Share Price
Key Insights
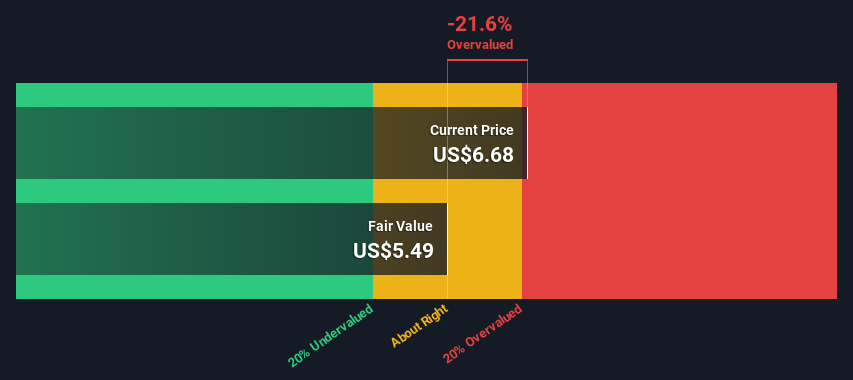
Ranpak Holdings' estimated fair value is US$5.49 based on 2 Stage Free Cash Flow to Equity
Ranpak Holdings is estimated to be 22% overvalued based on current share price of US$6.68
The US$6.67 analyst price target for PACK is 21% more than our estimate of fair value
Today we'll do a simple run through of a valuation method used to estimate the attractiveness of Ranpak Holdings Corp. (NYSE:PACK) as an investment opportunity by taking the expected future cash flows and discounting them to their present value. We will use the Discounted Cash Flow (DCF) model on this occasion. There's really not all that much to it, even though it might appear quite complex.
Remember though, that there are many ways to estimate a company's value, and a DCF is just one method. If you still have some burning questions about this type of valuation, take a look at the Simply Wall St analysis model.
See our latest analysis for Ranpak Holdings
Is Ranpak Holdings Fairly Valued?
We're using the 2-stage growth model, which simply means we take in account two stages of company's growth. In the initial period the company may have a higher growth rate and the second stage is usually assumed to have a stable growth rate. To start off with, we need to estimate the next ten years of cash flows. Where possible we use analyst estimates, but when these aren't available we extrapolate the previous free cash flow (FCF) from the last estimate or reported value. We assume companies with shrinking free cash flow will slow their rate of shrinkage, and that companies with growing free cash flow will see their growth rate slow, over this period. We do this to reflect that growth tends to slow more in the early years than it does in later years.
A DCF is all about the idea that a dollar in the future is less valuable than a dollar today, and so the sum of these future cash flows is then discounted to today's value:
10-year free cash flow (FCF) forecast
2024 | 2025 | 2026 | 2027 | 2028 | 2029 | 2030 | 2031 | 2032 | 2033 | |
Levered FCF ($, Millions) | US$5.50m | US$9.33m | US$13.9m | US$18.8m | US$23.6m | US$27.9m | US$31.7m | US$34.9m | US$37.6m | US$39.8m |
Growth Rate Estimate Source | Analyst x1 | Est @ 69.65% | Est @ 49.38% | Est @ 35.20% | Est @ 25.27% | Est @ 18.33% | Est @ 13.46% | Est @ 10.06% | Est @ 7.67% | Est @ 6.00% |
Present Value ($, Millions) Discounted @ 8.1% | US$5.1 | US$8.0 | US$11.0 | US$13.8 | US$16.0 | US$17.5 | US$18.3 | US$18.6 | US$18.6 | US$18.2 |
("Est" = FCF growth rate estimated by Simply Wall St)
Present Value of 10-year Cash Flow (PVCF) = US$145m
After calculating the present value of future cash flows in the initial 10-year period, we need to calculate the Terminal Value, which accounts for all future cash flows beyond the first stage. For a number of reasons a very conservative growth rate is used that cannot exceed that of a country's GDP growth. In this case we have used the 5-year average of the 10-year government bond yield (2.1%) to estimate future growth. In the same way as with the 10-year 'growth' period, we discount future cash flows to today's value, using a cost of equity of 8.1%.
Terminal Value (TV)= FCF2033 × (1 + g) ÷ (r – g) = US$40m× (1 + 2.1%) ÷ (8.1%– 2.1%) = US$674m
Present Value of Terminal Value (PVTV)= TV / (1 + r)10= US$674m÷ ( 1 + 8.1%)10= US$308m
The total value, or equity value, is then the sum of the present value of the future cash flows, which in this case is US$453m. In the final step we divide the equity value by the number of shares outstanding. Relative to the current share price of US$6.7, the company appears slightly overvalued at the time of writing. Remember though, that this is just an approximate valuation, and like any complex formula - garbage in, garbage out.
The Assumptions
Now the most important inputs to a discounted cash flow are the discount rate, and of course, the actual cash flows. You don't have to agree with these inputs, I recommend redoing the calculations yourself and playing with them. The DCF also does not consider the possible cyclicality of an industry, or a company's future capital requirements, so it does not give a full picture of a company's potential performance. Given that we are looking at Ranpak Holdings as potential shareholders, the cost of equity is used as the discount rate, rather than the cost of capital (or weighted average cost of capital, WACC) which accounts for debt. In this calculation we've used 8.1%, which is based on a levered beta of 1.015. Beta is a measure of a stock's volatility, compared to the market as a whole. We get our beta from the industry average beta of globally comparable companies, with an imposed limit between 0.8 and 2.0, which is a reasonable range for a stable business.
SWOT Analysis for Ranpak Holdings
Strength
No major strengths identified for PACK.
Weakness
Interest payments on debt are not well covered.
Expensive based on P/S ratio and estimated fair value.
Opportunity
Forecast to reduce losses next year.
Has sufficient cash runway for more than 3 years based on current free cash flows.
Significant insider buying over the past 3 months.
Threat
Debt is not well covered by operating cash flow.
Not expected to become profitable over the next 3 years.
Next Steps:
Although the valuation of a company is important, it is only one of many factors that you need to assess for a company. The DCF model is not a perfect stock valuation tool. Preferably you'd apply different cases and assumptions and see how they would impact the company's valuation. For example, changes in the company's cost of equity or the risk free rate can significantly impact the valuation. Can we work out why the company is trading at a premium to intrinsic value? For Ranpak Holdings, there are three additional items you should assess:
Risks: For example, we've discovered 2 warning signs for Ranpak Holdings that you should be aware of before investing here.
Future Earnings: How does PACK's growth rate compare to its peers and the wider market? Dig deeper into the analyst consensus number for the upcoming years by interacting with our free analyst growth expectation chart.
Other Solid Businesses: Low debt, high returns on equity and good past performance are fundamental to a strong business. Why not explore our interactive list of stocks with solid business fundamentals to see if there are other companies you may not have considered!
PS. The Simply Wall St app conducts a discounted cash flow valuation for every stock on the NYSE every day. If you want to find the calculation for other stocks just search here.
Have feedback on this article? Concerned about the content? Get in touch with us directly. Alternatively, email editorial-team (at) simplywallst.com.
This article by Simply Wall St is general in nature. We provide commentary based on historical data and analyst forecasts only using an unbiased methodology and our articles are not intended to be financial advice. It does not constitute a recommendation to buy or sell any stock, and does not take account of your objectives, or your financial situation. We aim to bring you long-term focused analysis driven by fundamental data. Note that our analysis may not factor in the latest price-sensitive company announcements or qualitative material. Simply Wall St has no position in any stocks mentioned.
