RB Global, Inc.'s (NYSE:RBA) Stock Is Going Strong: Have Financials A Role To Play?
RB Global's (NYSE:RBA) stock is up by a considerable 14% over the past three months. As most would know, fundamentals are what usually guide market price movements over the long-term, so we decided to look at the company's key financial indicators today to determine if they have any role to play in the recent price movement. Particularly, we will be paying attention to RB Global's ROE today.
ROE or return on equity is a useful tool to assess how effectively a company can generate returns on the investment it received from its shareholders. Simply put, it is used to assess the profitability of a company in relation to its equity capital.
See our latest analysis for RB Global
How Do You Calculate Return On Equity?
The formula for return on equity is:
Return on Equity = Net Profit (from continuing operations) ÷ Shareholders' Equity
So, based on the above formula, the ROE for RB Global is:
3.1% = US$167m ÷ US$5.4b (Based on the trailing twelve months to September 2023).
The 'return' is the yearly profit. Another way to think of that is that for every $1 worth of equity, the company was able to earn $0.03 in profit.
What Is The Relationship Between ROE And Earnings Growth?
So far, we've learned that ROE is a measure of a company's profitability. Based on how much of its profits the company chooses to reinvest or "retain", we are then able to evaluate a company's future ability to generate profits. Assuming all else is equal, companies that have both a higher return on equity and higher profit retention are usually the ones that have a higher growth rate when compared to companies that don't have the same features.
A Side By Side comparison of RB Global's Earnings Growth And 3.1% ROE
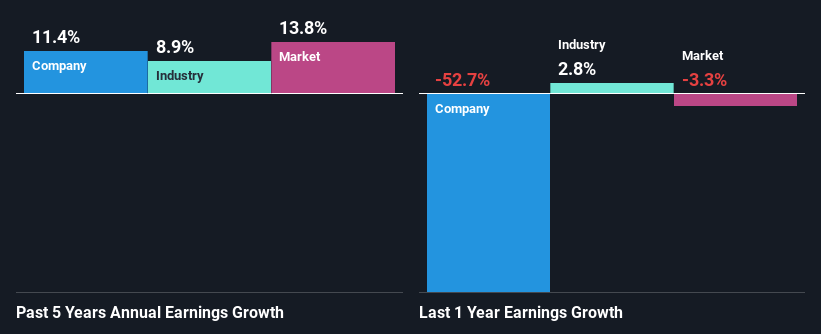
It is hard to argue that RB Global's ROE is much good in and of itself. Even when compared to the industry average of 8.7%, the ROE figure is pretty disappointing. However, the moderate 11% net income growth seen by RB Global over the past five years is definitely a positive. Therefore, the growth in earnings could probably have been caused by other variables. For instance, the company has a low payout ratio or is being managed efficiently.
As a next step, we compared RB Global's net income growth with the industry, and pleasingly, we found that the growth seen by the company is higher than the average industry growth of 8.9%.
Earnings growth is a huge factor in stock valuation. The investor should try to establish if the expected growth or decline in earnings, whichever the case may be, is priced in. By doing so, they will have an idea if the stock is headed into clear blue waters or if swampy waters await. What is RBA worth today? The intrinsic value infographic in our free research report helps visualize whether RBA is currently mispriced by the market.
Is RB Global Making Efficient Use Of Its Profits?
The high three-year median payout ratio of 55% (or a retention ratio of 45%) for RB Global suggests that the company's growth wasn't really hampered despite it returning most of its income to its shareholders.
Additionally, RB Global has paid dividends over a period of at least ten years which means that the company is pretty serious about sharing its profits with shareholders. Our latest analyst data shows that the future payout ratio of the company is expected to drop to 39% over the next three years. As a result, the expected drop in RB Global's payout ratio explains the anticipated rise in the company's future ROE to 11%, over the same period.
Summary
In total, it does look like RB Global has some positive aspects to its business. That is, quite an impressive growth in earnings. However, the low profit retention means that the company's earnings growth could have been higher, had it been reinvesting a higher portion of its profits. With that said, the latest industry analyst forecasts reveal that the company's earnings are expected to accelerate. To know more about the latest analysts predictions for the company, check out this visualization of analyst forecasts for the company.
Have feedback on this article? Concerned about the content? Get in touch with us directly. Alternatively, email editorial-team (at) simplywallst.com.
This article by Simply Wall St is general in nature. We provide commentary based on historical data and analyst forecasts only using an unbiased methodology and our articles are not intended to be financial advice. It does not constitute a recommendation to buy or sell any stock, and does not take account of your objectives, or your financial situation. We aim to bring you long-term focused analysis driven by fundamental data. Note that our analysis may not factor in the latest price-sensitive company announcements or qualitative material. Simply Wall St has no position in any stocks mentioned.
