Read This Before You Buy Community Trust Bancorp, Inc. (NASDAQ:CTBI) Because Of Its P/E Ratio

This article is written for those who want to get better at using price to earnings ratios (P/E ratios). To keep it practical, we'll show how Community Trust Bancorp, Inc.'s (NASDAQ:CTBI) P/E ratio could help you assess the value on offer. What is Community Trust Bancorp's P/E ratio? Well, based on the last twelve months it is 12.55. That means that at current prices, buyers pay $12.55 for every $1 in trailing yearly profits.
See our latest analysis for Community Trust Bancorp
How Do You Calculate A P/E Ratio?
The formula for price to earnings is:
Price to Earnings Ratio = Price per Share ÷ Earnings per Share (EPS)
Or for Community Trust Bancorp:
P/E of 12.55 = $45.51 ÷ $3.63 (Based on the trailing twelve months to September 2019.)
Is A High Price-to-Earnings Ratio Good?
The higher the P/E ratio, the higher the price tag of a business, relative to its trailing earnings. That isn't a good or a bad thing on its own, but a high P/E means that buyers have a higher opinion of the business's prospects, relative to stocks with a lower P/E.
How Does Community Trust Bancorp's P/E Ratio Compare To Its Peers?
One good way to get a quick read on what market participants expect of a company is to look at its P/E ratio. The image below shows that Community Trust Bancorp has a P/E ratio that is roughly in line with the banks industry average (12.9).
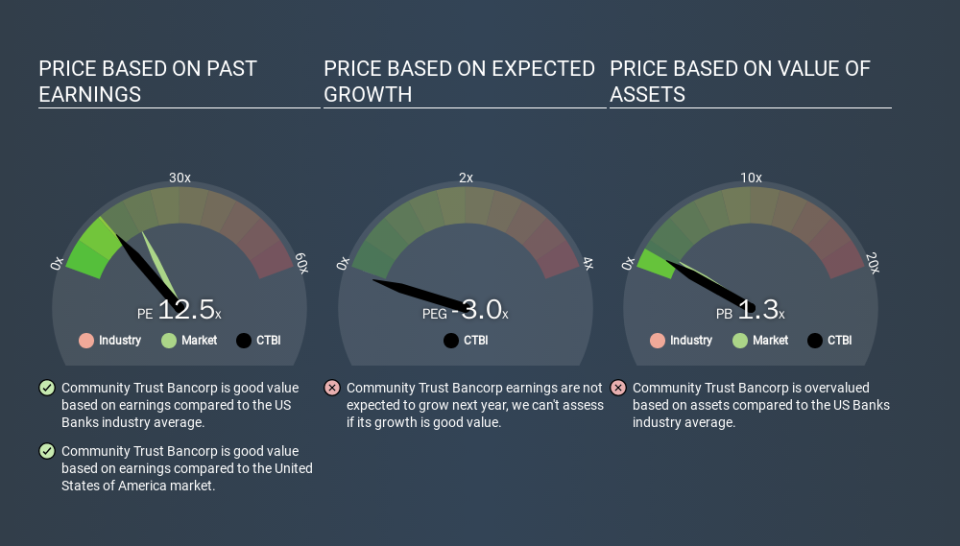
Community Trust Bancorp's P/E tells us that market participants think its prospects are roughly in line with its industry. So if Community Trust Bancorp actually outperforms its peers going forward, that should be a positive for the share price. Checking factors such as director buying and selling. could help you form your own view on if that will happen.
How Growth Rates Impact P/E Ratios
P/E ratios primarily reflect market expectations around earnings growth rates. If earnings are growing quickly, then the 'E' in the equation will increase faster than it would otherwise. That means even if the current P/E is high, it will reduce over time if the share price stays flat. So while a stock may look expensive based on past earnings, it could be cheap based on future earnings.
Community Trust Bancorp saw earnings per share improve by -9.7% last year. And earnings per share have improved by 8.4% annually, over the last five years.
Remember: P/E Ratios Don't Consider The Balance Sheet
One drawback of using a P/E ratio is that it considers market capitalization, but not the balance sheet. So it won't reflect the advantage of cash, or disadvantage of debt. In theory, a company can lower its future P/E ratio by using cash or debt to invest in growth.
While growth expenditure doesn't always pay off, the point is that it is a good option to have; but one that the P/E ratio ignores.
Community Trust Bancorp's Balance Sheet
Net debt is 27% of Community Trust Bancorp's market cap. While that's enough to warrant consideration, it doesn't really concern us.
The Bottom Line On Community Trust Bancorp's P/E Ratio
Community Trust Bancorp trades on a P/E ratio of 12.5, which is below the US market average of 18.7. The company does have a little debt, and EPS is moving in the right direction. If you believe growth will continue - or even increase - then the low P/E may signify opportunity.
When the market is wrong about a stock, it gives savvy investors an opportunity. As value investor Benjamin Graham famously said, 'In the short run, the market is a voting machine but in the long run, it is a weighing machine. So this free visualization of the analyst consensus on future earnings could help you make the right decision about whether to buy, sell, or hold.
Of course, you might find a fantastic investment by looking at a few good candidates. So take a peek at this free list of companies with modest (or no) debt, trading on a P/E below 20.
If you spot an error that warrants correction, please contact the editor at editorial-team@simplywallst.com. This article by Simply Wall St is general in nature. It does not constitute a recommendation to buy or sell any stock, and does not take account of your objectives, or your financial situation. Simply Wall St has no position in the stocks mentioned.
We aim to bring you long-term focused research analysis driven by fundamental data. Note that our analysis may not factor in the latest price-sensitive company announcements or qualitative material. Thank you for reading.
