Read This Before You Buy Kingworld Medicines Group Limited (HKG:1110) Because Of Its P/E Ratio

Want to participate in a research study? Help shape the future of investing tools and earn a $60 gift card!
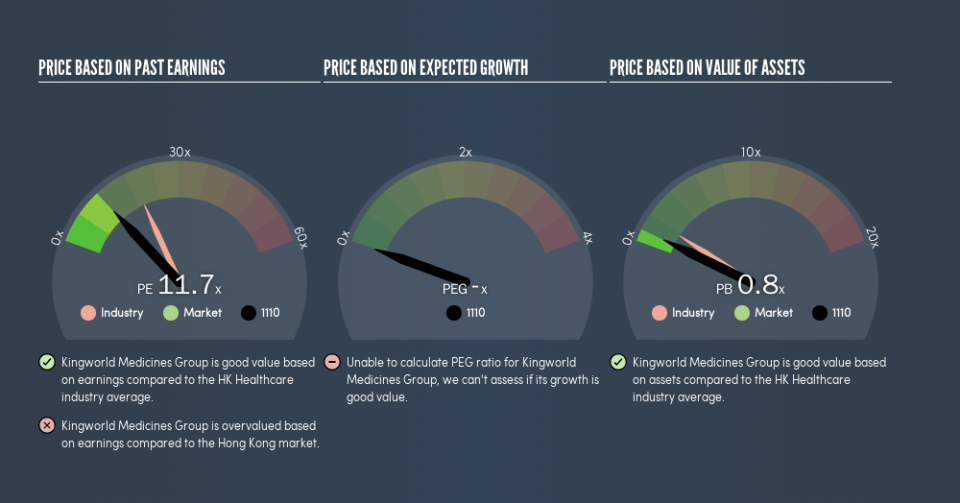
The goal of this article is to teach you how to use price to earnings ratios (P/E ratios). To keep it practical, we'll show how Kingworld Medicines Group Limited's (HKG:1110) P/E ratio could help you assess the value on offer. Based on the last twelve months, Kingworld Medicines Group's P/E ratio is 11.66. That is equivalent to an earnings yield of about 8.6%.
Check out our latest analysis for Kingworld Medicines Group
How Do I Calculate A Price To Earnings Ratio?
The formula for P/E is:
Price to Earnings Ratio = Price per Share (in the reporting currency) ÷ Earnings per Share (EPS)
Or for Kingworld Medicines Group:
P/E of 11.66 = CN¥0.77 (Note: this is the share price in the reporting currency, namely, CNY ) ÷ CN¥0.066 (Based on the year to December 2018.)
Is A High Price-to-Earnings Ratio Good?
A higher P/E ratio means that investors are paying a higher price for each HK$1 of company earnings. That isn't a good or a bad thing on its own, but a high P/E means that buyers have a higher opinion of the business's prospects, relative to stocks with a lower P/E.
How Growth Rates Impact P/E Ratios
Probably the most important factor in determining what P/E a company trades on is the earnings growth. Earnings growth means that in the future the 'E' will be higher. Therefore, even if you pay a high multiple of earnings now, that multiple will become lower in the future. A lower P/E should indicate the stock is cheap relative to others -- and that may attract buyers.
Kingworld Medicines Group shrunk earnings per share by 20% over the last year. But over the longer term (5 years) earnings per share have increased by 4.7%.
How Does Kingworld Medicines Group's P/E Ratio Compare To Its Peers?
The P/E ratio indicates whether the market has higher or lower expectations of a company. We can see in the image below that the average P/E (19.5) for companies in the healthcare industry is higher than Kingworld Medicines Group's P/E.
Kingworld Medicines Group's P/E tells us that market participants think it will not fare as well as its peers in the same industry. Since the market seems unimpressed with Kingworld Medicines Group, it's quite possible it could surprise on the upside. You should delve deeper. I like to check if company insiders have been buying or selling.
Remember: P/E Ratios Don't Consider The Balance Sheet
Don't forget that the P/E ratio considers market capitalization. Thus, the metric does not reflect cash or debt held by the company. Theoretically, a business can improve its earnings (and produce a lower P/E in the future), by taking on debt (or spending its remaining cash).
Such expenditure might be good or bad, in the long term, but the point here is that the balance sheet is not reflected by this ratio.
How Does Kingworld Medicines Group's Debt Impact Its P/E Ratio?
Net debt totals 31% of Kingworld Medicines Group's market cap. If you want to compare its P/E ratio to other companies, you should absolutely keep in mind it has significant borrowings.
The Verdict On Kingworld Medicines Group's P/E Ratio
Kingworld Medicines Group has a P/E of 11.7. That's around the same as the average in the HK market, which is 11.8. Given it has some debt, but didn't grow last year, the P/E indicates the market is expecting higher profits ahead for the business.
When the market is wrong about a stock, it gives savvy investors an opportunity. If the reality for a company is not as bad as the P/E ratio indicates, then the share price should increase as the market realizes this. Although we don't have analyst forecasts, shareholders might want to examine this detailed historical graph of earnings, revenue and cash flow.
Of course, you might find a fantastic investment by looking at a few good candidates. So take a peek at this free list of companies with modest (or no) debt, trading on a P/E below 20.
We aim to bring you long-term focused research analysis driven by fundamental data. Note that our analysis may not factor in the latest price-sensitive company announcements or qualitative material.
If you spot an error that warrants correction, please contact the editor at editorial-team@simplywallst.com. This article by Simply Wall St is general in nature. It does not constitute a recommendation to buy or sell any stock, and does not take account of your objectives, or your financial situation. Simply Wall St has no position in the stocks mentioned. Thank you for reading.
