Read This Before You Buy Morgan Advanced Materials plc (LON:MGAM) Because Of Its P/E Ratio

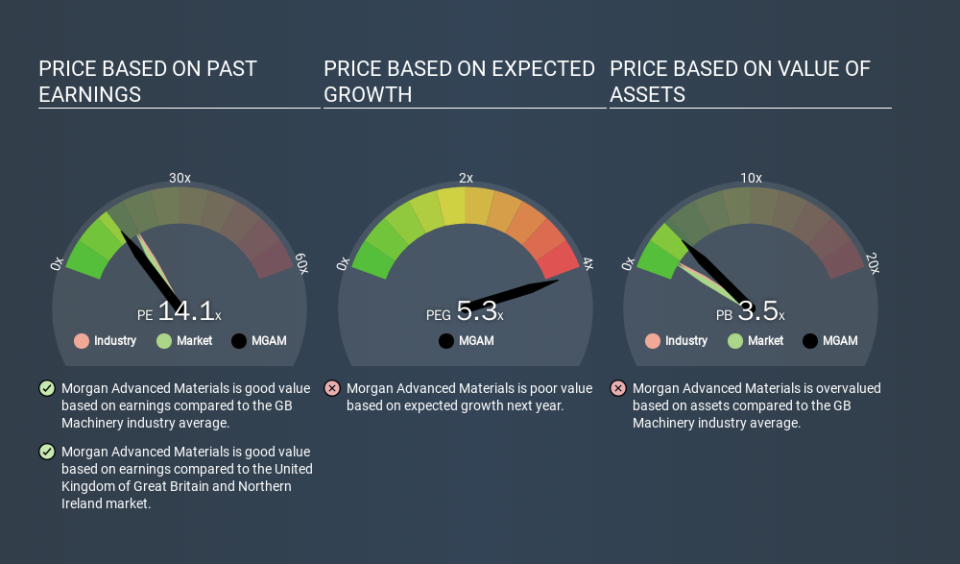
This article is for investors who would like to improve their understanding of price to earnings ratios (P/E ratios). We'll look at Morgan Advanced Materials plc's (LON:MGAM) P/E ratio and reflect on what it tells us about the company's share price. What is Morgan Advanced Materials's P/E ratio? Well, based on the last twelve months it is 14.13. That is equivalent to an earnings yield of about 7.1%.
View our latest analysis for Morgan Advanced Materials
How Do You Calculate A P/E Ratio?
The formula for P/E is:
Price to Earnings Ratio = Share Price ÷ Earnings per Share (EPS)
Or for Morgan Advanced Materials:
P/E of 14.13 = £2.87 ÷ £0.20 (Based on the year to June 2019.)
Is A High P/E Ratio Good?
The higher the P/E ratio, the higher the price tag of a business, relative to its trailing earnings. That is not a good or a bad thing per se, but a high P/E does imply buyers are optimistic about the future.
Does Morgan Advanced Materials Have A Relatively High Or Low P/E For Its Industry?
The P/E ratio indicates whether the market has higher or lower expectations of a company. The image below shows that Morgan Advanced Materials has a lower P/E than the average (17.7) P/E for companies in the machinery industry.
Its relatively low P/E ratio indicates that Morgan Advanced Materials shareholders think it will struggle to do as well as other companies in its industry classification. Since the market seems unimpressed with Morgan Advanced Materials, it's quite possible it could surprise on the upside. You should delve deeper. I like to check if company insiders have been buying or selling.
How Growth Rates Impact P/E Ratios
Generally speaking the rate of earnings growth has a profound impact on a company's P/E multiple. That's because companies that grow earnings per share quickly will rapidly increase the 'E' in the equation. That means unless the share price increases, the P/E will reduce in a few years. Then, a lower P/E should attract more buyers, pushing the share price up.
Morgan Advanced Materials shrunk earnings per share by 13% over the last year. But EPS is up 6.8% over the last 5 years.
Remember: P/E Ratios Don't Consider The Balance Sheet
The 'Price' in P/E reflects the market capitalization of the company. In other words, it does not consider any debt or cash that the company may have on the balance sheet. In theory, a company can lower its future P/E ratio by using cash or debt to invest in growth.
While growth expenditure doesn't always pay off, the point is that it is a good option to have; but one that the P/E ratio ignores.
Is Debt Impacting Morgan Advanced Materials's P/E?
Net debt totals 24% of Morgan Advanced Materials's market cap. That's enough debt to impact the P/E ratio a little; so keep it in mind if you're comparing it to companies without debt.
The Bottom Line On Morgan Advanced Materials's P/E Ratio
Morgan Advanced Materials has a P/E of 14.1. That's below the average in the GB market, which is 17.1. With only modest debt, it's likely the lack of EPS growth at least partially explains the pessimism implied by the P/E ratio.
Investors should be looking to buy stocks that the market is wrong about. If it is underestimating a company, investors can make money by buying and holding the shares until the market corrects itself. So this free visualization of the analyst consensus on future earnings could help you make the right decision about whether to buy, sell, or hold.
You might be able to find a better buy than Morgan Advanced Materials. If you want a selection of possible winners, check out this free list of interesting companies that trade on a P/E below 20 (but have proven they can grow earnings).
If you spot an error that warrants correction, please contact the editor at editorial-team@simplywallst.com. This article by Simply Wall St is general in nature. It does not constitute a recommendation to buy or sell any stock, and does not take account of your objectives, or your financial situation. Simply Wall St has no position in the stocks mentioned.
We aim to bring you long-term focused research analysis driven by fundamental data. Note that our analysis may not factor in the latest price-sensitive company announcements or qualitative material. Thank you for reading.
