Read This Before You Buy RCI Hospitality Holdings, Inc. (NASDAQ:RICK) Because Of Its P/E Ratio

Want to participate in a research study? Help shape the future of investing tools and earn a $60 gift card!
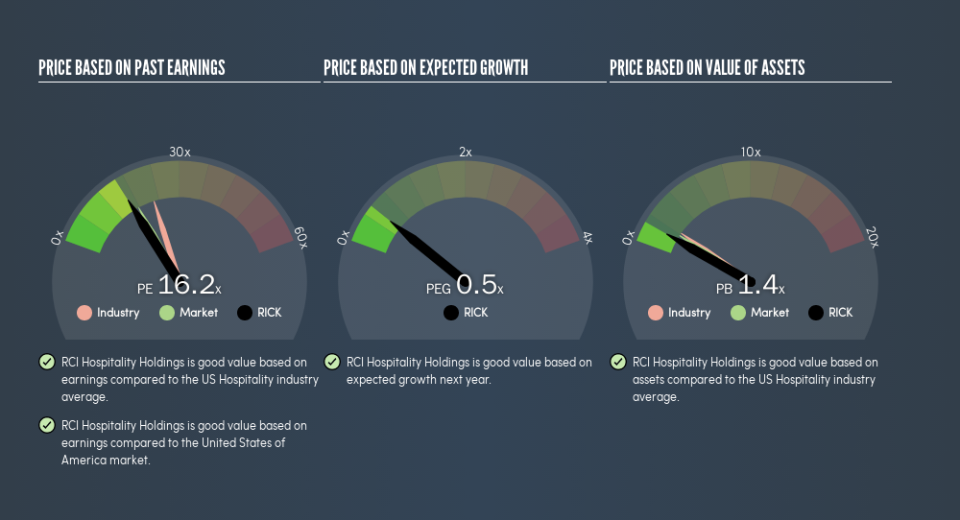
The goal of this article is to teach you how to use price to earnings ratios (P/E ratios). To keep it practical, we'll show how RCI Hospitality Holdings, Inc.'s (NASDAQ:RICK) P/E ratio could help you assess the value on offer. RCI Hospitality Holdings has a P/E ratio of 16.24, based on the last twelve months. That means that at current prices, buyers pay $16.24 for every $1 in trailing yearly profits.
Check out our latest analysis for RCI Hospitality Holdings
How Do You Calculate A P/E Ratio?
The formula for price to earnings is:
Price to Earnings Ratio = Price per Share ÷ Earnings per Share (EPS)
Or for RCI Hospitality Holdings:
P/E of 16.24 = $22.97 ÷ $1.41 (Based on the year to December 2018.)
Is A High P/E Ratio Good?
A higher P/E ratio means that investors are paying a higher price for each $1 of company earnings. That isn't a good or a bad thing on its own, but a high P/E means that buyers have a higher opinion of the business's prospects, relative to stocks with a lower P/E.
How Growth Rates Impact P/E Ratios
Earnings growth rates have a big influence on P/E ratios. That's because companies that grow earnings per share quickly will rapidly increase the 'E' in the equation. That means even if the current P/E is high, it will reduce over time if the share price stays flat. So while a stock may look expensive based on past earnings, it could be cheap based on future earnings.
RCI Hospitality Holdings shrunk earnings per share by 30% over the last year. But EPS is up 16% over the last 5 years.
How Does RCI Hospitality Holdings's P/E Ratio Compare To Its Peers?
The P/E ratio indicates whether the market has higher or lower expectations of a company. If you look at the image below, you can see RCI Hospitality Holdings has a lower P/E than the average (22.5) in the hospitality industry classification.
RCI Hospitality Holdings's P/E tells us that market participants think it will not fare as well as its peers in the same industry. While current expectations are low, the stock could be undervalued if the situation is better than the market assumes. It is arguably worth checking if insiders are buying shares, because that might imply they believe the stock is undervalued.
Remember: P/E Ratios Don't Consider The Balance Sheet
Don't forget that the P/E ratio considers market capitalization. Thus, the metric does not reflect cash or debt held by the company. In theory, a company can lower its future P/E ratio by using cash or debt to invest in growth.
Spending on growth might be good or bad a few years later, but the point is that the P/E ratio does not account for the option (or lack thereof).
How Does RCI Hospitality Holdings's Debt Impact Its P/E Ratio?
Net debt totals 65% of RCI Hospitality Holdings's market cap. If you want to compare its P/E ratio to other companies, you should absolutely keep in mind it has significant borrowings.
The Bottom Line On RCI Hospitality Holdings's P/E Ratio
RCI Hospitality Holdings's P/E is 16.2 which is below average (17.7) in the US market. Given meaningful debt, and a lack of recent growth, the market looks to be extrapolating this recent performance; reflecting low expectations for the future.
Investors should be looking to buy stocks that the market is wrong about. As value investor Benjamin Graham famously said, 'In the short run, the market is a voting machine but in the long run, it is a weighing machine.' So this free visual report on analyst forecasts could hold the key to an excellent investment decision.
Of course you might be able to find a better stock than RCI Hospitality Holdings. So you may wish to see this free collection of other companies that have grown earnings strongly.
We aim to bring you long-term focused research analysis driven by fundamental data. Note that our analysis may not factor in the latest price-sensitive company announcements or qualitative material.
If you spot an error that warrants correction, please contact the editor at editorial-team@simplywallst.com. This article by Simply Wall St is general in nature. It does not constitute a recommendation to buy or sell any stock, and does not take account of your objectives, or your financial situation. Simply Wall St has no position in the stocks mentioned. Thank you for reading.
