Read This Before Buying P. H. Glatfelter Company (NYSE:GLT) For Its Dividend
Dividend paying stocks like P. H. Glatfelter Company (NYSE:GLT) tend to be popular with investors, and for good reason - some research suggests a significant amount of all stock market returns come from reinvested dividends. On the other hand, investors have been known to buy a stock because of its yield, and then lose money if the company's dividend doesn't live up to expectations.
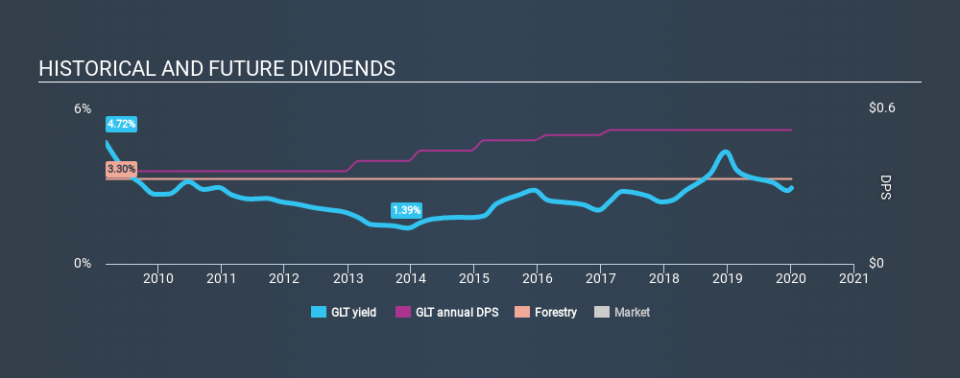
A slim 2.9% yield is hard to get excited about, but the long payment history is respectable. At the right price, or with strong growth opportunities, P. H. Glatfelter could have potential. Some simple analysis can offer a lot of insights when buying a company for its dividend, and we'll go through this below.
Click the interactive chart for our full dividend analysis
Payout ratios
Dividends are typically paid from company earnings. If a company pays more in dividends than it earned, then the dividend might become unsustainable - hardly an ideal situation. As a result, we should always investigate whether a company can afford its dividend, measured as a percentage of a company's net income after tax. In the last year, P. H. Glatfelter paid out 141% of its profit as dividends. Unless there are extenuating circumstances, from the perspective of an investor who hopes to own the company for many years, a payout ratio of above 100% is definitely a concern.
Another important check we do is to see if the free cash flow generated is sufficient to pay the dividend. P. H. Glatfelter's cash payout ratio last year was 7.5%. Cash flows are typically lumpy, but this looks like an appropriately conservative payout. It's good to see that while P. H. Glatfelter's dividends were not covered by profits, at least they are affordable from a cash perspective. If executives were to continue paying more in dividends than the company reported in profits, we'd view this as a warning sign. Very few companies are able to sustainably pay dividends larger than their reported earnings.
Is P. H. Glatfelter's Balance Sheet Risky?
As P. H. Glatfelter's dividend was not well covered by earnings, we need to check its balance sheet for signs of financial distress. A rough way to check this is with these two simple ratios: a) net debt divided by EBITDA (earnings before interest, tax, depreciation and amortisation), and b) net interest cover. Net debt to EBITDA is a measure of a company's total debt. Net interest cover measures the ability to meet interest payments. Essentially we check that a) the company does not have too much debt, and b) that it can afford to pay the interest. With net debt of 2.81 times its EBITDA, P. H. Glatfelter's debt burden is within a normal range for most listed companies.
Net interest cover can be calculated by dividing earnings before interest and tax (EBIT) by the company's net interest expense. With EBIT of 4.67 times its interest expense, P. H. Glatfelter's interest cover is starting to look a bit thin.
We update our data on P. H. Glatfelter every 24 hours, so you can always get our latest analysis of its financial health, here.
Dividend Volatility
Before buying a stock for its income, we want to see if the dividends have been stable in the past, and if the company has a track record of maintaining its dividend. P. H. Glatfelter has been paying dividends for a long time, but for the purpose of this analysis, we only examine the past 10 years of payments. During this period the dividend has been stable, which could imply the business could have relatively consistent earnings power. During the past ten-year period, the first annual payment was US$0.36 in 2010, compared to US$0.52 last year. This works out to be a compound annual growth rate (CAGR) of approximately 3.7% a year over that time.
Dividends have grown relatively slowly, which is not great, but some investors may value the relative consistency of the dividend.
Dividend Growth Potential
Dividend payments have been consistent over the past few years, but we should always check if earnings per share (EPS) are growing, as this will help maintain the purchasing power of the dividend. P. H. Glatfelter's earnings per share have shrunk at 25% a year over the past five years. A sharp decline in earnings per share is not great from from a dividend perspective, as even conservative payout ratios can come under pressure if earnings fall far enough.
Conclusion
To summarise, shareholders should always check that P. H. Glatfelter's dividends are affordable, that its dividend payments are relatively stable, and that it has decent prospects for growing its earnings and dividend. We're not keen on the fact that P. H. Glatfelter paid out such a high percentage of its income, although its cashflow is in better shape. Moreover, earnings have been shrinking. While the dividends have been fairly steady, we'd wonder for how much longer this will be sustainable if earnings continue to decline. While we're not hugely bearish on it, overall we think there are potentially better dividend stocks than P. H. Glatfelter out there.
See if management have their own wealth at stake, by checking insider shareholdings in P. H. Glatfelter stock.
We have also put together a list of global stocks with a market capitalisation above $1bn and yielding more 3%.
If you spot an error that warrants correction, please contact the editor at editorial-team@simplywallst.com. This article by Simply Wall St is general in nature. It does not constitute a recommendation to buy or sell any stock, and does not take account of your objectives, or your financial situation. Simply Wall St has no position in the stocks mentioned.
We aim to bring you long-term focused research analysis driven by fundamental data. Note that our analysis may not factor in the latest price-sensitive company announcements or qualitative material. Thank you for reading.
