Is a Recession Imminent? The Fed's Leading Indicator, Which Hasn't Been Wrong Since 1966, Offers a Clear Answer.
When examined over long periods, Wall Street's three major stock indexes -- the widely followed Dow Jones Industrial Average (DJINDICES: ^DJI), broad-based S&P 500 (SNPINDEX: ^GSPC), and growth-dependent Nasdaq Composite (NASDAQINDEX: ^IXIC) -- have risen in value, without fail.
But it's a far different story when the lens is narrowed to mere months or perhaps a few years. The Dow Jones, S&P 500, and Nasdaq Composite, just like the U.S. economy, can be completely unpredictable over shorter timelines. In fact, all three stock indexes have traded off bear and bull markets in successive years since this decade began.
Truth be told, there is no perfect forecasting tool or ideal blueprint that's going to, with 100% accuracy, tell investors or economists what stocks or the U.S. economy will do next. Nevertheless, there are a couple of predictive tools and money-based metrics that have, over extended timelines, correlated strongly with moves in the stock market and/or U.S. economy.
One of these indicators, which happens to be a leading tool from the Federal Reserve Bank of New York, has an uncanny track record of forecasting downturns in the U.S. economy.

Is a recession imminent in the U.S.?
At the moment, the U.S. economy is humming along nicely. U.S. gross domestic product is growing on an annualized basis and the labor market appears healthy, with the unemployment rate clocking in at a low 3.7% for January. But all may not be what it seems.
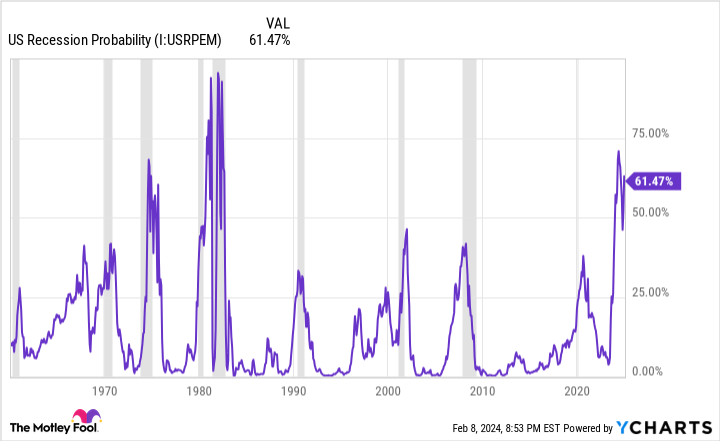
Every month for the past 65 years, the Federal Reserve Bank of New York's recession probability tool has utilized the spread (difference in yield) between the 10-year Treasury bond and three-month Treasury bill to determine how likely it is that a recession will take shape over the next 12 months.
Normally, the Treasury yield curve slopes up and to the right. This is to say that bonds set to mature in 10 or 30 years should have higher yields than Treasury bills maturing in one year or less. The longer your money is tied up in interest-bearing securities, the higher the yield should be.
But every now and then, when investors are clearly concerned about the near-term outlook for the U.S. economy, the yield curve inverts. Just as its name implies, this is when short-term bills sport higher yields than long-term bonds. The greater the yield-curve inversion, typically the higher the probability of a recession taking shape.
Let me make one thing clear: a yield-curve inversion doesn't guarantee a recession is imminent. There have been inversions where a recession didn't take shape. However, every recession that's occurred since World War II was preceded by a yield-curve inversion. It's been a necessary ingredient to an economic downturn.
Over the past year, we've witnessed the steepest yield-curve inversion in roughly four decades. Not surprisingly, the Federal Reserve Bank of New York's recession probability tool believes there to be a 61.47% likelihood of a recession taking place by or before January 2025. Although this isn't a guarantee, nor is it the highest recession probability on record, it does mark the one of the highest probabilities for a recession to take place since the early 1980s.
The Fed's leading recession indicator doesn't have a perfect track record of forecasting downturns -- but it's pretty darn close. Despite a recession probability of over 40% in October 1966, no economic downturn occurred. But since this incorrect prognostication in 1966, any time this recession probability tool has surpassed a 32% likelihood of a downturn, one has taken place not long thereafter. With a reading of 61.47%, the writing would appear to be on the wall that a recession is very likely in 2024, based on this predictive indicator.
Recessions can be especially meaningful for the Dow Jones, S&P 500, and Nasdaq Composite because these indexes have, historically, performed poorly after an official recession is declared by the National Bureau of Economic Research. Although the U.S. economy and the stock market act independently of one another, corporate earnings often suffer when U.S. economic activity slows or shifts into reverse.
If the NY Fed's recession tool proves accurate, and a recession does take shape in 2024, a sizable pullback in equities isn't out of the question.

Patience is a virtue and a moneymaker on Wall Street
To be fair, the Fed's recession probability tool is just one of around a half-dozen indicators and economic data points I've examined recently that suggest trouble may be brewing for stocks. Declining M2 money supply, tighter lending standards for banks, and historically high valuations, are all examples of metrics with strong correlations to downturns in the stock market.
However, patience and perspective can change everything when putting your money to work on Wall Street.
To state the obvious, we're never going to know ahead of time precisely when stock market corrections and/or bear markets will begin, how long they'll last, or how steep these declines will ultimately be. But based on what decades of history have shown us, we also know that recessions and stock market corrections are both short-lived events.
In the 78 years since World War II came to a close, the U.S. economy has navigated its way through 12 downturns. Nine of these contractions resolved themselves in less than a year. Out of the remaining three, none surpassed 18 months. Comparatively, almost every period of expansion can be measured in multiple years. Put another way, the U.S. economy spends a disproportionate amount of time expanding.
It's a similar story on Wall Street. Although the S&P 500 has endured 40 double-digit percentage corrections since the start of 1950 -- an average of one sizable downturn every 1.85 years -- we've witnessed each and every one of these drops eventually get wiped away by a bull market.
It's official. A new bull market is confirmed.
The S&P 500 is now up 20% from its 10/12/22 closing low. The prior bear market saw the index fall 25.4% over 282 days.
Read more at https://t.co/H4p1RcpfIn. pic.twitter.com/tnRz1wdonp-- Bespoke (@bespokeinvest) June 8, 2023
This "disproportionate bullishness" can also be seen in the average length of bear and bull markets for the benchmark S&P 500.
This past June, researchers at Bespoke Investment Group released a data set that examined the length of bear and bull markets in the S&P 500 dating back to the start of the Great Recession in September 1929. While the average bear market has stuck around for only 286 calendar days, or about 9.5 months, the typical bull market since the late 1920s has endured for 1,011 calendar days, or about two years and nine months.
Though stock market corrections, bear markets, and even crashes can be temporarily unpleasant, they're short-lived events that have, ultimately, been blessings in disguise for patient investors. Even if a recession is in the cards for 2024, there's no reason for long-term investors to worry.
Where to invest $1,000 right now
When our analyst team has a stock tip, it can pay to listen. After all, the newsletter they have run for over a decade, Motley Fool Stock Advisor, has nearly tripled the market.*
They just revealed what they believe are the 10 best stocks for investors to buy right now…
*Stock Advisor returns as of February 5, 2024
Sean Williams has no position in any of the stocks mentioned. The Motley Fool has no position in any of the stocks mentioned. The Motley Fool has a disclosure policy.
Is a Recession Imminent? The Fed's Leading Indicator, Which Hasn't Been Wrong Since 1966, Offers a Clear Answer. was originally published by The Motley Fool

