Red Pine Continues to Expand and Follow New Zones of Gold Mineralization West of the Jubilee Shear - drills 6.15 g/t Au over 11.67 m

Figure 1
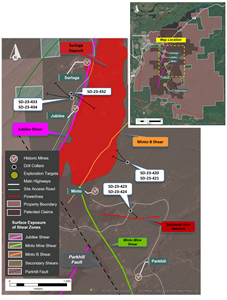
Figure 2
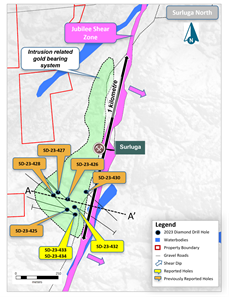
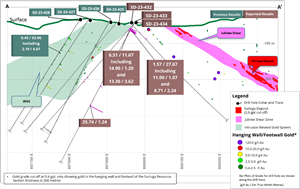
Figure 3
TORONTO, July 11, 2023 (GLOBE NEWSWIRE) -- Red Pine Exploration Inc. (TSXV: RPX, OTCQB: RDEXF) (“Red Pine” or the “Company”) reports drilling results from its ongoing exploration program. The new results continue to validate the presence of multiple zones of mineralization in the Wawa Gold Corridor west of the Jubilee Shear and within the intrusion related gold system (IRGS). Mineralization was also extended in the Sadowski Vein Network and in new mineralization zones east of the Jubilee Shear.
Mineralization extends in the Footwall of the Jubilee Shear in the Wawa Gold Corridor (Figures 1 and 2)
Confirmation of gold mineralization west of the Jubilee Shear in the intrusion-related gold system, in zones of orogenic overprint and the extensional vein networks
Near-surface discovery in a zone of orogenic overprint of 6.15 g/t gold over 11.67 m in SD-23-434 that includes 11.16 g/t Au over 5.93 m (Figure 3)
Extension of intrusion-related gold mineralization with the intersection of 1.57 g/t gold over 26.3 meters including 25.74 g/t gold over 1.24 m in SD-23-433
Hanging wall of (above) the Jubilee Shear (Figure 1)
Sadowski Vein Network
Intersection of 6.86 g/t gold over 1.00 meter and 6.03 g/t gold over 1.00 meter indicating that gold mineralization extends laterally
Quentin Yarie, President and CEO of Red Pine Exploration commented:
“The new results from this systematic drill program of the Wawa Gold Corridor (planned for the revised resource) confirms the presence of near-surface and significant gold mineralization west of the Jubilee Shear and lies very close to the 2019 resource of the Surluga Deposit. Mineralization is open in all directions, and we now have additional evidence that high-grade gold zones can be present in the Intrusion Related Gold System.”
Table 1– Highlights from drilling in the Wawa Gold Corridor (Figure 1)
Hole | From (m) | To | Length (m)* | Visible Gold | Gold (g/t) | Zone |
|
| (m) |
|
|
|
|
JS-22-375 | 88.71 | 89.90 | 1.19 |
| 1.47 | Jubilee Shear – South of PH fault |
184.03 | 185.41 | 1.38 |
| 1.27 | Jubilee Shear – South of PH fault | |
SD-23-420 | 79.58 | 86.46 | 6.88 |
| 0.95 | New Zone East of Jubilee Shear |
Including | ||||||
81.00 | 82.88 | 1.88 |
| 2.40 | ||
370.63 | 376.54 | 5.91 |
| 0.48 | Jubilee Shear | |
383.3 | 385.68 | 2.38 |
| 1.03 | ||
SD-23-421 | 84.9 | 93.44 | 8.54 |
| 0.58 | New Zone East of Jubilee Shear |
SD-23-423 | 60.27 | 61.16 | 0.89 | VG | 0.53 | Sadowski Vein Network |
SD-23-424 | 57.49 | 58.49 | 1.00 | VG | 6.86 | Sadowski Vein Network |
71.36 | 72.36 | 1.00 | VG | 6.03 | ||
SD-23-432 | 37.96 | 42.21 | 4.25 |
| 0.67 | Core Shack Vein Network |
63.00 | 66.00 | 3.00 | VG | 1.42 | Core Shack Vein Network | |
377.57 | 380.06 | 2.49 |
| 1.57 | Jubilee Vein Network | |
SD-23-433 | 11.95 | 39.62 | 27.67 |
| 1.57 | New zone of IRGS/Orogenic overprint |
Including | ||||||
17.00 | 18.07 | 1.07 |
| 11.00 | ||
21.45 | 23.69 | 2.24 |
| 8.71 | ||
190.88 | 206.14 | 15.26 |
| 0.54 | IRGS | |
239.34 | 265.64 | 26.30 |
| 1.57 | ||
Including | ||||||
264.4 | 265.64 | 1.24 |
| 25.74 | ||
SD-23-434 | 15.00 | 26.67 | 11.67 |
| 6.15 | New zone of IRGS/Orogenic overprint |
| Including | |||||
| 17.00 | 18.20 | 1.20 |
| 14.90 | |
| 19.31 | 22.93 | 3.62 |
| 13.30 | |
| 114.11 | 125.69 | 11.58 |
| 0.85 | IRGS |
|
|
|
|
|
| |
| 195.00 | 199.60 | 4.60 |
| 0.90 | |
| 213.00 | 215.17 | 2.17 |
| 1.51 | |
Assay results presented over core length. True width for the intersections varies between 50 to 95% depending on the intersected geological structure.
Quality Assurance/Quality Control ("QA/QC") Measures
Drill core samples were transported in security sealed bags for analyses to Actlabs in Ancaster, Ontario. Individual samples were labelled, placed in plastic sample bags and sealed. Groups of samples were then placed into durable rice bags and shipped. The residual coarse reject portions of the samples remain in storage if further work or verification is needed.
Red Pine has implemented a quality-control program to comply with best practices in the sampling and analysis of drill core. As part of its QA/QC program, Red Pine inserts external gold standards (low to high grade) and blanks every 20 samples in addition to random standards, blanks, and duplicates.
Qualified Person
Quentin Yarie, P.Geo. and Chief Executive Officer of Red Pine and the Qualified Person, as defined by National Instrument 43-101, has reviewed, and approved the news release’s technical information.
About Red Pine Exploration Inc.
Red Pine Exploration Inc. is a gold exploration company headquartered in Toronto, Ontario, Canada. The Company's shares trade on the TSX Venture Exchange under the symbol "RPX" and on the OTCQB Markets under the symbol “RDEXF”.
The Wawa Gold Project is in the Michipicoten Greenstone Belt of Ontario, a region that has seen major investment by several producers in the last five years. Its land package hosts numerous historic gold mines and is over 7,030 hectares in size. Led by Quentin Yarie, CEO, who has over 25 years of experience in mineral exploration, Red Pine is strengthening its position as a major mineral exploration and development player in the Michipicoten region.
For more information about the Company, visit www.redpineexp.com.
Or contact:
Quentin Yarie, President and CEO, (416) 364-7024, qyarie@redpineexp.com
Or
Carrie Howes, Director Corporate Communications, (416) 644-7375, chowes@redpineexp.com
1 National Instrument 43-101 Technical Report for the Wawa Gold Project, Brian Thomas P.Geo. Golder Associates Ltd, report effective June, 21, 2023.
Neither TSX Venture Exchange nor its Regulation Services Provider (as that term is defined in policies of the TSX Venture Exchange) accepts responsibility for the adequacy or accuracy of this release.
Cautionary Note Regarding Forward-Looking Information
This news release contains statements which constitute “forward-looking information” within the meaning of applicable securities laws, including statements regarding the plans, intentions, beliefs and current expectations of the Company with respect to future business activities and operating performance.
Forward-looking information is often identified by the words “may”, “would”, “could”, “should”, “will”, “intend”, “plan”, “anticipate”, “believe”, “estimate”, “expect” or similar expressions. Forward-looking information contained in this news release includes but may not be limited to:” the potential for a hybrid pit and underground project”. Investors are cautioned that forward-looking information is not based on historical facts but instead reflect management’s expectations, estimates or projections concerning future results or events based on the opinions, assumptions and estimates of management considered reasonable at the date the statements are made. Such opinions, assumptions and estimates are inherently subject to a variety of risks and uncertainties that could cause actual events or results to differ materially from those projected and undue reliance should not be placed on such information, as unknown or unpredictable factors could have material adverse effects on future results, performance or achievements. Among the key factors that could cause actual results to differ materially from those projected in the forward-looking information are the following: the Company's expectations in connection with the projects and exploration programs being met, the impact of general business and economic conditions, global liquidity and credit availability on the timing of cash flows and the values of assets and liabilities based on projected future conditions, fluctuating gold prices, currency exchange rates (such as the Canadian dollar versus the United States Dollar), variations in ore grade or recovery rates, changes in accounting policies, changes in the Company's mineral reserves and resources, changes in project parameters as plans continue to be refined, changes in project development, construction, production and commissioning time frames, the possibility of project cost overruns or unanticipated costs and expenses, higher prices for fuel, power, labour and other consumables contributing to higher costs and general risks of the mining industry, failure of plant, equipment or processes to operate as anticipated, unexpected changes in mine life, seasonality and weather, costs and timing of the development of new deposits, success of exploration activities, permitting time lines, government regulation of mining operations, environmental risks, unanticipated reclamation expenses, title disputes or claims, and limitations on insurance.
This information is qualified in its entirety by cautionary statements and risk factor disclosure contained in filings made by the Company, including the Company’s annual information form, financial statements and related MD&A for the year ended July 31, 2022, and the interim financial reports and related MD&A for the period ended April 30, 2023, filed with the securities’ regulatory authorities in certain provinces of Canada and available at www.sedar.com.
Should one or more of these risks or uncertainties materialize, or should assumptions underlying the forward-looking information prove incorrect, actual results may vary materially from those described herein as intended, planned, anticipated, believed, estimated or expected. Although the Company has attempted to identify important risks, uncertainties and factors which could cause actual results to differ materially, there may be others that cause results not to be as anticipated, estimated or intended. The Company does not intend, and does not assume any obligation, to update this forward-looking information except as otherwise required by applicable law.

Figure 1 - Plan Map of the Drilling Results
https://www.globenewswire.com/NewsRoom/AttachmentNg/df32a396-79a4-48c1-a435-987e5e994d30
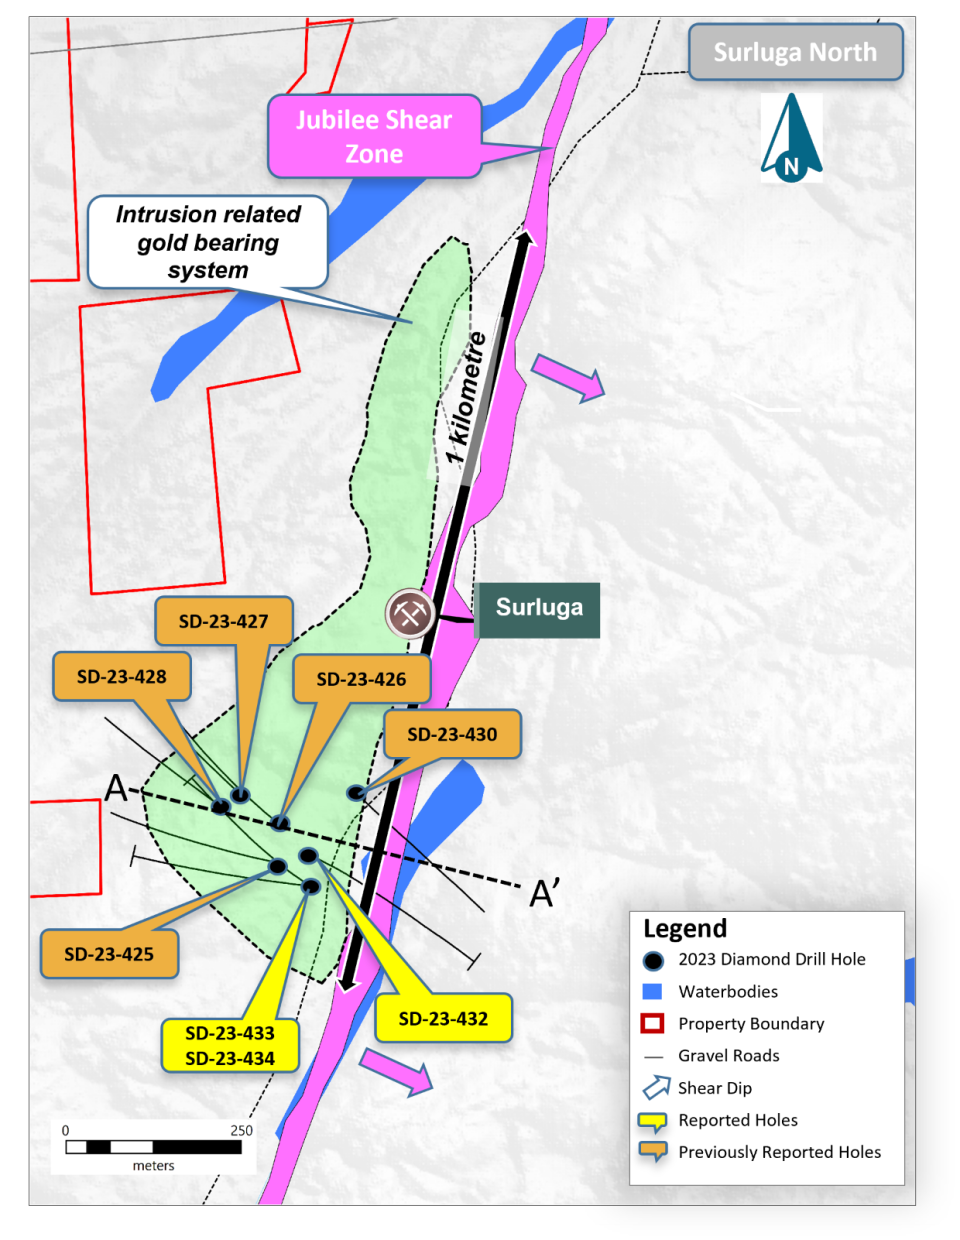
Figure 2 - Plan Map of the IGRS in the Footwall of the Surluga Deposit
https://www.globenewswire.com/NewsRoom/AttachmentNg/5e47fed9-824e-4261-b7ad-a71ce5eb022c
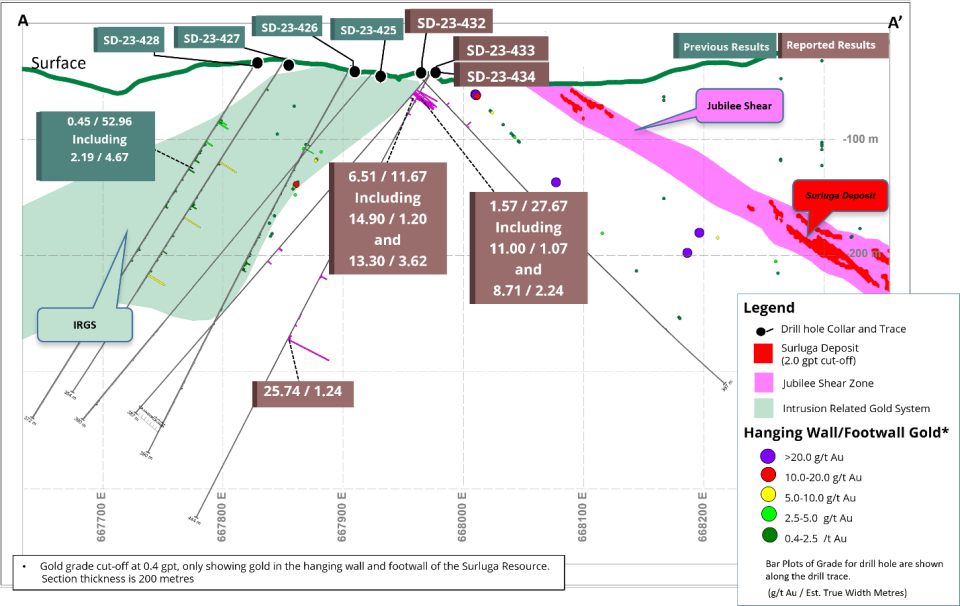
Figure 3 - Cross Section of Holes in the IGRS
https://www.globenewswire.com/NewsRoom/AttachmentNg/fb03ad32-a02e-4d46-99e3-c274526ab51c

