Regulus Therapeutics (RGLS): An Attractive Valuation or a Potential Value Trap?
Value-focused investors are always on the hunt for stocks that are priced below their intrinsic value. One such stock that merits attention is Regulus Therapeutics Inc (NASDAQ:RGLS). The stock, which is currently priced at 1.76, recorded a gain of 17.33% in a day and a 3-month increase of 24.82%. The stock's fair valuation is $3.51, as indicated by its GF Value.
Understanding the GF Value
The GF Value represents the current intrinsic value of a stock derived from our exclusive method. The GF Value Line on our summary page gives an overview of the fair value that the stock should be traded at. It is calculated based on three factors: historical multiples (PE Ratio, PS Ratio, PB Ratio and Price-to-Free-Cash-Flow) that the stock has traded at, GuruFocus adjustment factor based on the company's past returns and growth, and future estimates of the business performance.
Risks Associated with Regulus Therapeutics (NASDAQ:RGLS)
However, investors need to consider a more in-depth analysis before making an investment decision. Despite its seemingly attractive valuation, certain risk factors associated with Regulus Therapeutics should not be ignored. These risks are primarily reflected through its low Altman Z-score of 0, and a Beneish M-Score of 0 that exceeds -1.78, the threshold for potential earnings manipulation. These indicators suggest that Regulus Therapeutics, despite its apparent undervaluation, might be a potential value trap. This complexity underlines the importance of thorough due diligence in investment decision-making.
Understanding the Altman Z-Score and Beneish M-Score
Before delving into the details, let's understand what the Altman Z-score entails. Invented by New York University Professor Edward I. Altman in 1968, the Z-Score is a financial model that predicts the probability of a company entering bankruptcy within a two-year time frame. The Altman Z-Score combines five different financial ratios, each weighted to create a final score. A score below 1.8 suggests a high likelihood of financial distress, while a score above 3 indicates a low risk.
Developed by Professor Messod Beneish, the Beneish M-Score is based on eight financial variables that reflect different aspects of a company's financial performance and position. These are Days Sales Outstanding (DSO), Gross Margin (GM), Total Long-term Assets Less Property, Plant and Equipment over Total Assets (TATA), change in Revenue (?REV), change in Depreciation and Amortization (?DA), change in Selling, General and Admin expenses (?SGA), change in Debt-to-Asset Ratio (?LVG), and Net Income Less Non-Operating Income and Cash Flow from Operations over Total Assets (?NOATA).
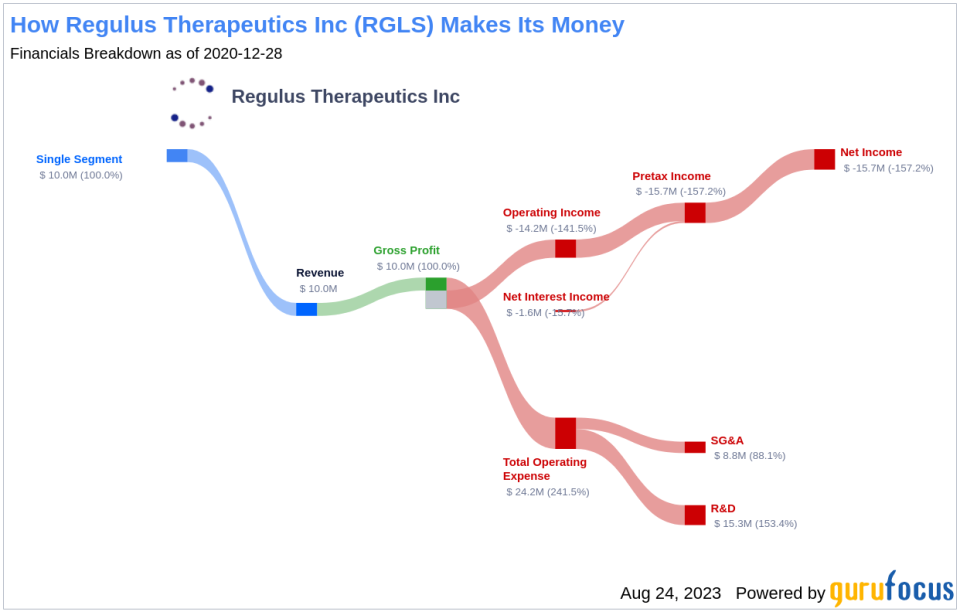
Company Snapshot: Regulus Therapeutics
Regulus Therapeutics Inc is a biotechnology company focused on the development of microRNA therapies. MicroRNA therapies target diseases such as cancer, metabolic diseases, fibrosis, and inflammatory diseases. MicroRNA is a noncoding ribonucleic acid that regulates most genes in the genome. The company partnered with Sanofi to create a compound targeting orphan diseases and with AstraZeneca to cure Type 2 Diabetes/prediabetes.
Regulus Therapeutics's Low Altman Z-Score: A Breakdown of Key Drivers
A dissection of Regulus Therapeutics's Altman Z-score reveals Regulus Therapeutics's financial health may be weak, suggesting possible financial distress:
The first factor to consider is a measure of short-term liquidity. This is calculated as the working capital divided by total assets. When evaluating the data provided: 2021: 0.07; 2022: 0.05; 2023: 0.03, it's clear that Regulus Therapeutics has experienced a recent decline following an initial increase in its Working Capital to Total Assets ratio over the past few years. This decline suggests potential liquidity issues that the company may be facing. The ratio is strikingly low, which unfavorably influences the overall Z-Score.
The EBIT to Total Assets ratio serves as a crucial barometer of a company's operational effectiveness, correlating earnings before interest and taxes (EBIT) to total assets. An analysis of Regulus Therapeutics's EBIT to Total Assets ratio from historical data (2021: -0.27; 2022: -0.53; 2023: -0.64) indicates a recent dip following an initial rise. This reduction suggests that Regulus Therapeutics might not be utilizing its assets to their full potential to generate operational profits, which could be negatively affecting the company's overall Z-score.
When it comes to operational efficiency, a vital indicator for Regulus Therapeutics is its asset turnover. The data: 2021: 0.27; 2022: 0; 2023: 0 from the past three years suggests a recent decline following an initial increase in this ratio. The asset turnover ratio reflects how effectively a company is using its assets to generate sales. Therefore, a drop in this ratio can signify reduced operational efficiency, potentially due to underutilization of assets or decreased market demand for the company's products or services. This shift in Regulus Therapeutics's asset turnover underlines the need for the company to reassess its operational strategies to optimize asset usage and boost sales.
The Gross Margin index tracks the evolution of a company's gross profit as a proportion of its revenue. A downward trend could indicate issues such as overproduction or more generous credit terms, both of which are potential red flags for earnings manipulation. By examining the past three years of Regulus Therapeutics's historical data (2021: 0; 2022: 0; 2023: 0), we find that its Gross Margin has contracted by 0%. Such a contraction in the gross margin can negatively impact the company's profitability as it signifies lesser income from each dollar of sales. This could put a strain on the company's capacity to manage operating costs, potentially undermining its financial stability.
The change in Depreciation, Depletion, and Amortization (DDA) reflects the rate at which a company's assets lose value over time. Analyzing Regulus Therapeutics's DDA data over the past three years (2021: 0.60; 2022: 0.14; 2023: 0.16), a decreasing rate might be a cause for concern. This decline may suggest that the company is prolonging the useful life of its assets, possibly to manipulate earnings. By extending the lifespan of assets, depreciation charges are spread over a longer period, thereby reducing annual expenses and artificially boosting reported profits. While this may create a more favorable short-term financial picture, it could also distort the true value and condition of the company's assets, misleading investors and potentially hiding underlying operational or financial issues.
Conclusion: Regulus Therapeutics - A Potential Value Trap?
Despite its seemingly attractive valuation, the financial health and performance of Regulus Therapeutics (NASDAQ:RGLS) suggest potential risks. The company's low Altman Z-Score and Beneish M-Score, coupled with declining key financial ratios, indicate potential financial distress and possible earnings manipulation. These factors, combined with the company's operational inefficiencies and liquidity issues, suggest that the stock might be a potential value trap. Therefore, thorough due diligence is crucial before making an investment decision.
GuruFocus Premium members can find stocks with high Altman Z-Score using the following Screener: Walter Schloss Screen . To find out the high quality companies that may deliver above average returns, please check out GuruFocus High Quality Low Capex Screener.
This article first appeared on GuruFocus.
