Reliance Worldwide's (ASX:RWC) earnings growth rate lags the 12% CAGR delivered to shareholders
One simple way to benefit from the stock market is to buy an index fund. But if you buy good businesses at attractive prices, your portfolio returns could exceed the average market return. For example, Reliance Worldwide Corporation Limited (ASX:RWC) shareholders have seen the share price rise 28% over three years, well in excess of the market return (21%, not including dividends). On the other hand, the returns haven't been quite so good recently, with shareholders up just 13% , including dividends .
Since the long term performance has been good but there's been a recent pullback of 3.8%, let's check if the fundamentals match the share price.
View our latest analysis for Reliance Worldwide
To paraphrase Benjamin Graham: Over the short term the market is a voting machine, but over the long term it's a weighing machine. One way to examine how market sentiment has changed over time is to look at the interaction between a company's share price and its earnings per share (EPS).
Reliance Worldwide was able to grow its EPS at 19% per year over three years, sending the share price higher. This EPS growth is higher than the 9% average annual increase in the share price. So one could reasonably conclude that the market has cooled on the stock.
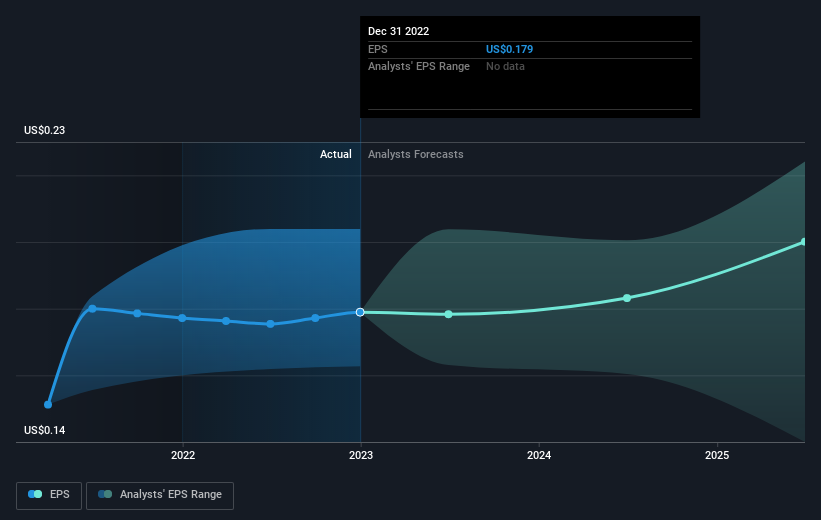
The graphic below depicts how EPS has changed over time (unveil the exact values by clicking on the image).
We like that insiders have been buying shares in the last twelve months. Even so, future earnings will be far more important to whether current shareholders make money. This free interactive report on Reliance Worldwide's earnings, revenue and cash flow is a great place to start, if you want to investigate the stock further.
What About Dividends?
As well as measuring the share price return, investors should also consider the total shareholder return (TSR). Whereas the share price return only reflects the change in the share price, the TSR includes the value of dividends (assuming they were reinvested) and the benefit of any discounted capital raising or spin-off. Arguably, the TSR gives a more comprehensive picture of the return generated by a stock. As it happens, Reliance Worldwide's TSR for the last 3 years was 39%, which exceeds the share price return mentioned earlier. And there's no prize for guessing that the dividend payments largely explain the divergence!
A Different Perspective
It's nice to see that Reliance Worldwide shareholders have received a total shareholder return of 13% over the last year. Of course, that includes the dividend. Notably the five-year annualised TSR loss of 3% per year compares very unfavourably with the recent share price performance. This makes us a little wary, but the business might have turned around its fortunes. It's always interesting to track share price performance over the longer term. But to understand Reliance Worldwide better, we need to consider many other factors. Consider risks, for instance. Every company has them, and we've spotted 2 warning signs for Reliance Worldwide you should know about.
If you like to buy stocks alongside management, then you might just love this free list of companies. (Hint: insiders have been buying them).
Please note, the market returns quoted in this article reflect the market weighted average returns of stocks that currently trade on Australian exchanges.
Have feedback on this article? Concerned about the content? Get in touch with us directly. Alternatively, email editorial-team (at) simplywallst.com.
This article by Simply Wall St is general in nature. We provide commentary based on historical data and analyst forecasts only using an unbiased methodology and our articles are not intended to be financial advice. It does not constitute a recommendation to buy or sell any stock, and does not take account of your objectives, or your financial situation. We aim to bring you long-term focused analysis driven by fundamental data. Note that our analysis may not factor in the latest price-sensitive company announcements or qualitative material. Simply Wall St has no position in any stocks mentioned.
Join A Paid User Research Session
You’ll receive a US$30 Amazon Gift card for 1 hour of your time while helping us build better investing tools for the individual investors like yourself. Sign up here
