Are Repsol SA.’s (BME:REP) Interest Costs Too High?

The size of Repsol SA. (BME:REP), a €22.34B large-cap, often attracts investors seeking a reliable investment in the stock market. Market participants who are conscious of risk tend to search for large firms, attracted by the prospect of varied revenue sources and strong returns on capital. But, its financial health remains the key to continued success. I will provide an overview of Repsol’s financial liquidity and leverage to give you an idea of Repsol’s position to take advantage of potential acquisitions or comfortably endure future downturns. Note that this commentary is very high-level and solely focused on financial health, so I suggest you dig deeper yourself into REP here. View our latest analysis for Repsol
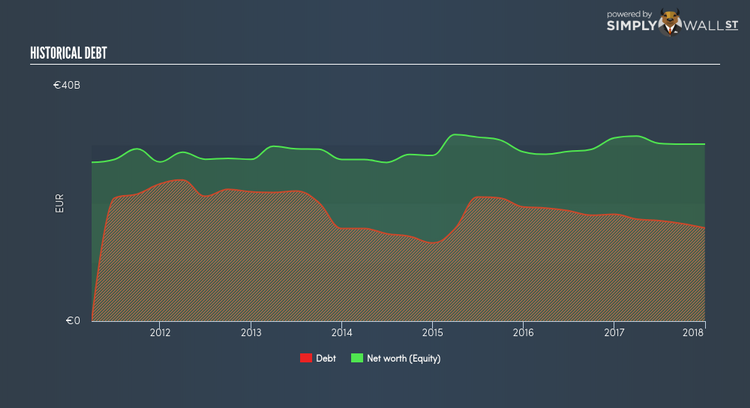
How much cash does REP generate through its operations?
REP has shrunken its total debt levels in the last twelve months, from €18.15B to €15.83B , which comprises of short- and long-term debt. With this debt payback, REP’s cash and short-term investments stands at €4.92B , ready to deploy into the business. On top of this, REP has generated €5.11B in operating cash flow during the same period of time, resulting in an operating cash to total debt ratio of 32.31%, meaning that REP’s current level of operating cash is high enough to cover debt. This ratio can also be interpreted as a measure of efficiency as an alternative to return on assets. In REP’s case, it is able to generate 0.32x cash from its debt capital.
Does REP’s liquid assets cover its short-term commitments?
Looking at REP’s most recent €12.04B liabilities, the company has been able to meet these commitments with a current assets level of €14.77B, leading to a 1.23x current account ratio. Usually, for Oil and Gas companies, this is a suitable ratio since there’s sufficient cash cushion without leaving too much capital idle or in low-earning investments.
Can REP service its debt comfortably?
With a debt-to-equity ratio of 52.65%, REP can be considered as an above-average leveraged company. This isn’t uncommon for large companies because interest payments on debt are tax deductible, meaning debt can be a cheaper source of capital than equity. Accordingly, large companies often have lower cost of capital due to easily obtained financing, providing an advantage over smaller companies. No matter how high the company’s debt, if it can easily cover the interest payments, it’s considered to be efficient with its use of excess leverage. Net interest should be covered by earnings before interest and tax (EBIT) by at least three times to be safe. For REP, the ratio of 8.14x suggests that interest is appropriately covered. Large-cap investments like REP are often believed to be a safe investment due to their ability to pump out ample earnings multiple times its interest payments.
Next Steps:
REP’s high cash coverage means that, although its debt levels are high, the company is able to utilise its borrowings efficiently in order to generate cash flow. This may mean this is an optimal capital structure for the business, given that it is also meeting its short-term commitment. Keep in mind I haven’t considered other factors such as how REP has been performing in the past. I recommend you continue to research Repsol to get a better picture of the large-cap by looking at:
Future Outlook: What are well-informed industry analysts predicting for REP’s future growth? Take a look at our free research report of analyst consensus for REP’s outlook.
Valuation: What is REP worth today? Is the stock undervalued, even when its growth outlook is factored into its intrinsic value? The intrinsic value infographic in our free research report helps visualize whether REP is currently mispriced by the market.
Other High-Performing Stocks: Are there other stocks that provide better prospects with proven track records? Explore our free list of these great stocks here.
To help readers see pass the short term volatility of the financial market, we aim to bring you a long-term focused research analysis purely driven by fundamental data. Note that our analysis does not factor in the latest price sensitive company announcements.
The author is an independent contributor and at the time of publication had no position in the stocks mentioned.
