Restaurant Brands International Inc's Dividend Analysis
Assessing the Sustainability of Restaurant Brands International Inc's Dividend
Restaurant Brands International Inc (NYSE:QSR) recently announced a dividend of $0.58 per share, payable on 2024-04-04, with the ex-dividend date set for 2024-03-20. As investors look forward to this upcoming payment, the spotlight also shines on the company's dividend history, yield, and growth rates. Using the data from GuruFocus, let's delve into Restaurant Brands International Inc's dividend performance and assess its sustainability.
What Does Restaurant Brands International Inc Do?
This Powerful Chart Made Peter Lynch 29% A Year For 13 Years
How to calculate the intrinsic value of a stock?
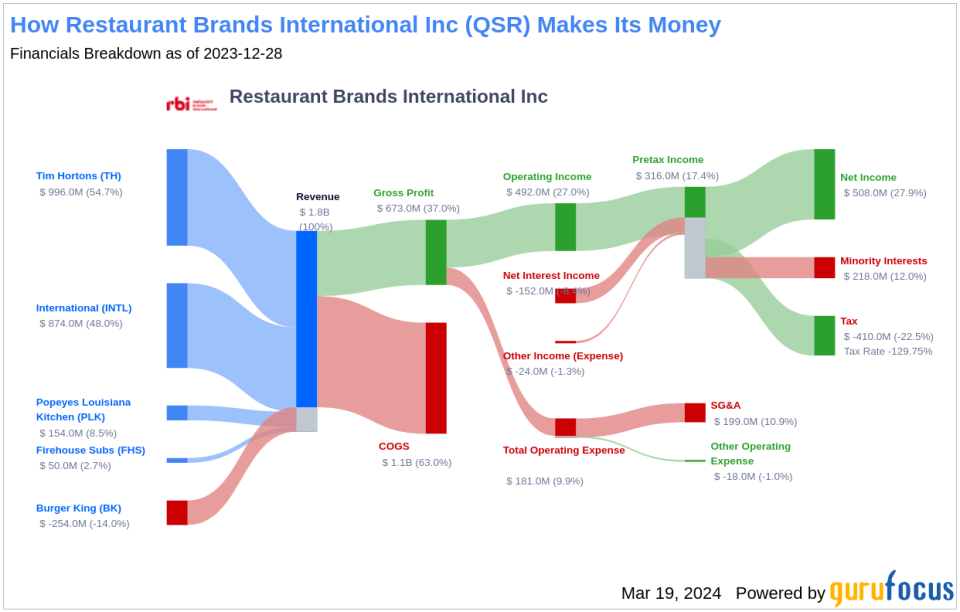
Restaurant Brands International is one of the world's largest restaurant companies, boasting approximately $43 billion in systemwide sales in 2023 across over 31,000 restaurants in more than 100 countries. The company generates revenue primarily from sales at company-owned restaurants, royalty fees, lease income from franchised stores, and Tim Hortons supply chain operations. Formed in 2014 after 3G Capital's acquisition of Tim Hortons International, the company's portfolio includes Burger King, Tim Hortons, Popeyes Louisiana Kitchen, Firehouse Subs, and international franchise units.
A Glimpse at Restaurant Brands International Inc's Dividend History
Restaurant Brands International Inc has upheld a consistent dividend payment record since 2015, with dividends being distributed quarterly. Below is a chart illustrating the annual Dividends Per Share to track historical trends.
Breaking Down Restaurant Brands International Inc's Dividend Yield and Growth
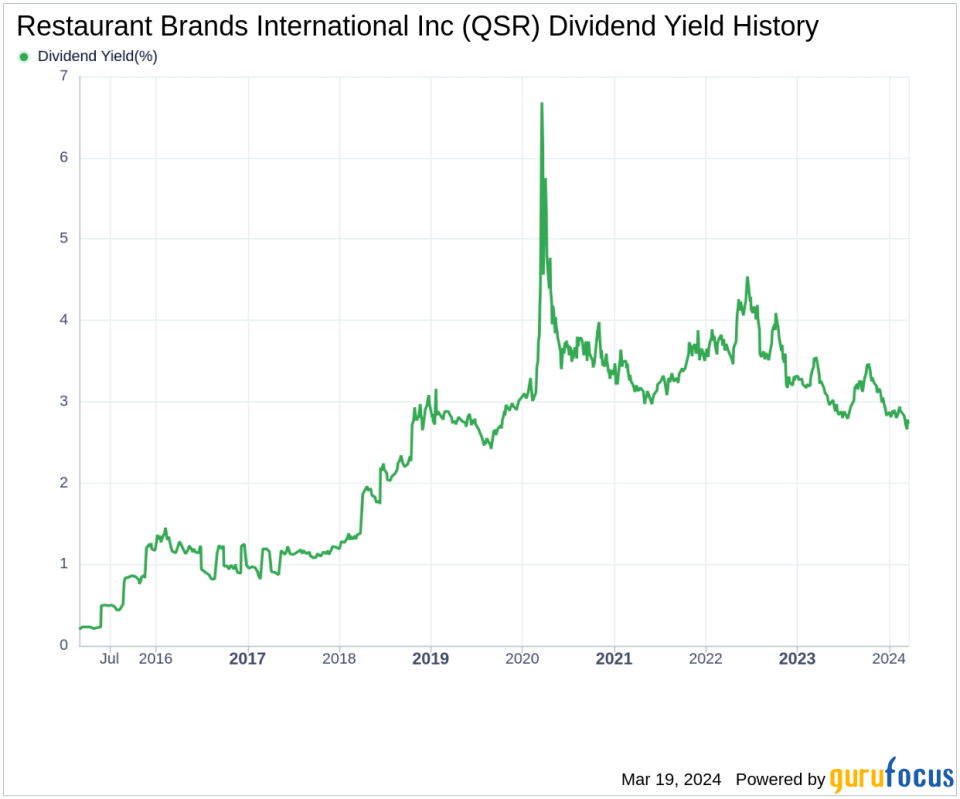
Restaurant Brands International Inc currently has a 12-month trailing dividend yield of 2.74% and a 12-month forward dividend yield of 2.89%, indicating an anticipated increase in dividend payments over the next year. Over the past three years, the company's annual dividend growth rate was 3.50%, which extended to 3.90% per year over a five-year horizon. Consequently, the 5-year yield on cost for Restaurant Brands International Inc stock is approximately 3.32% as of today.
The Sustainability Question: Payout Ratio and Profitability
The dividend payout ratio, which stands at 0.69 as of 2023-12-31, is crucial for evaluating the sustainability of dividends. It reveals the proportion of earnings distributed as dividends, with a lower ratio indicating more retained earnings for future growth and stability. Additionally, Restaurant Brands International Inc's profitability rank is a strong 8 out of 10, reflecting its relative earnings power. The company's consistent positive net income over the past decade bolsters its robust profitability profile.
Growth Metrics: The Future Outlook
Restaurant Brands International Inc's growth rank of 8 out of 10 suggests a favorable growth trajectory. Its revenue per share and 3-year revenue growth rate, averaging 15.00% annually, outperform approximately 81.35% of global competitors. The company's 3-year EPS growth rate, at an average of 19.00% per year, and the 5-year EBITDA growth rate of 8.10%, outperform 58.56% and 59.26% of global competitors, respectively. These figures underscore Restaurant Brands International Inc's potential for sustaining dividends.
Engaging Conclusion
Considering Restaurant Brands International Inc's dividend payments, growth rate, payout ratio, profitability, and growth metrics, the company appears well-positioned to maintain its dividend payments in the foreseeable future. With a solid track record and promising growth prospects, Restaurant Brands International Inc remains an attractive option for dividend-seeking investors. For those interested in further research, GuruFocus Premium offers tools like the High Dividend Yield Screener to discover high-yielding investment opportunities.
This article, generated by GuruFocus, is designed to provide general insights and is not tailored financial advice. Our commentary is rooted in historical data and analyst projections, utilizing an impartial methodology, and is not intended to serve as specific investment guidance. It does not formulate a recommendation to purchase or divest any stock and does not consider individual investment objectives or financial circumstances. Our objective is to deliver long-term, fundamental data-driven analysis. Be aware that our analysis might not incorporate the most recent, price-sensitive company announcements or qualitative information. GuruFocus holds no position in the stocks mentioned herein.
This article first appeared on GuruFocus.
