The Returns On Capital At Optiva (TSE:OPT) Don't Inspire Confidence

If we're looking to avoid a business that is in decline, what are the trends that can warn us ahead of time? When we see a declining return on capital employed (ROCE) in conjunction with a declining base of capital employed, that's often how a mature business shows signs of aging. This indicates to us that the business is not only shrinking the size of its net assets, but its returns are falling as well. So after we looked into Optiva (TSE:OPT), the trends above didn't look too great.
Return On Capital Employed (ROCE): What is it?
For those who don't know, ROCE is a measure of a company's yearly pre-tax profit (its return), relative to the capital employed in the business. To calculate this metric for Optiva, this is the formula:
Return on Capital Employed = Earnings Before Interest and Tax (EBIT) ÷ (Total Assets - Current Liabilities)
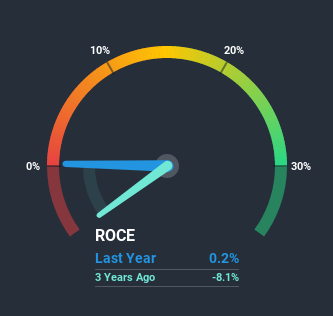
0.002 = US$114k ÷ (US$96m - US$39m) (Based on the trailing twelve months to March 2020).
Therefore, Optiva has an ROCE of 0.2%. In absolute terms, that's a low return and it also under-performs the Software industry average of 15%.
View our latest analysis for Optiva
Above you can see how the current ROCE for Optiva compares to its prior returns on capital, but there's only so much you can tell from the past. If you'd like, you can check out the forecasts from the analysts covering Optiva here for free.
The Trend Of ROCE
The trend of returns that Optiva is generating are raising some concerns. To be more specific, today's ROCE was 5.7% five years ago but has since fallen to 0.2%. In addition to that, Optiva is now employing 68% less capital than it was five years ago. The combination of lower ROCE and less capital employed can indicate that a business is likely to be facing some competitive headwinds or seeing an erosion to its moat. Typically businesses that exhibit these characteristics aren't the ones that tend to multiply over the long term, because statistically speaking, they've already gone through the growth phase of their life cycle.
Another thing to note, Optiva has a high ratio of current liabilities to total assets of 41%. This effectively means that suppliers (or short-term creditors) are funding a large portion of the business, so just be aware that this can introduce some elements of risk. Ideally we'd like to see this reduce as that would mean fewer obligations bearing risks.
What We Can Learn From Optiva's ROCE
In short, lower returns and decreasing amounts capital employed in the business doesn't fill us with confidence. Long term shareholders who've owned the stock over the last five years have experienced a 70% depreciation in their investment, so it appears the market might not like these trends either. With underlying trends that aren't great in these areas, we'd consider looking elsewhere.
If you want to continue researching Optiva, you might be interested to know about the 2 warning signs that our analysis has discovered.
While Optiva may not currently earn the highest returns, we've compiled a list of companies that currently earn more than 25% return on equity. Check out this free list here.
This article by Simply Wall St is general in nature. It does not constitute a recommendation to buy or sell any stock, and does not take account of your objectives, or your financial situation. We aim to bring you long-term focused analysis driven by fundamental data. Note that our analysis may not factor in the latest price-sensitive company announcements or qualitative material. Simply Wall St has no position in any stocks mentioned.
Have feedback on this article? Concerned about the content? Get in touch with us directly. Alternatively, email editorial-team@simplywallst.com.
