Returns On Capital At Oxford Metrics (LON:OMG) Paint A Concerning Picture
If we want to find a stock that could multiply over the long term, what are the underlying trends we should look for? Firstly, we'd want to identify a growing return on capital employed (ROCE) and then alongside that, an ever-increasing base of capital employed. Basically this means that a company has profitable initiatives that it can continue to reinvest in, which is a trait of a compounding machine. However, after investigating Oxford Metrics (LON:OMG), we don't think it's current trends fit the mold of a multi-bagger.
Understanding Return On Capital Employed (ROCE)
If you haven't worked with ROCE before, it measures the 'return' (pre-tax profit) a company generates from capital employed in its business. The formula for this calculation on Oxford Metrics is:
Return on Capital Employed = Earnings Before Interest and Tax (EBIT) ÷ (Total Assets - Current Liabilities)
0.057 = UK£4.9m ÷ (UK£99m - UK£13m) (Based on the trailing twelve months to September 2023).
So, Oxford Metrics has an ROCE of 5.7%. In absolute terms, that's a low return and it also under-performs the Software industry average of 9.3%.
View our latest analysis for Oxford Metrics
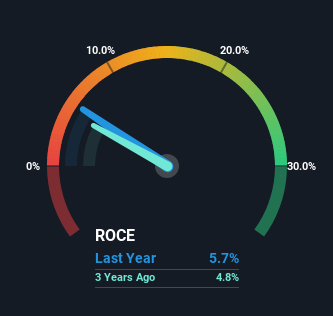
Above you can see how the current ROCE for Oxford Metrics compares to its prior returns on capital, but there's only so much you can tell from the past. If you'd like, you can check out the forecasts from the analysts covering Oxford Metrics here for free.
How Are Returns Trending?
When we looked at the ROCE trend at Oxford Metrics, we didn't gain much confidence. To be more specific, ROCE has fallen from 13% over the last five years. However, given capital employed and revenue have both increased it appears that the business is currently pursuing growth, at the consequence of short term returns. If these investments prove successful, this can bode very well for long term stock performance.
The Bottom Line
In summary, despite lower returns in the short term, we're encouraged to see that Oxford Metrics is reinvesting for growth and has higher sales as a result. And the stock has followed suit returning a meaningful 44% to shareholders over the last five years. So while the underlying trends could already be accounted for by investors, we still think this stock is worth looking into further.
If you want to know some of the risks facing Oxford Metrics we've found 2 warning signs (1 can't be ignored!) that you should be aware of before investing here.
While Oxford Metrics isn't earning the highest return, check out this free list of companies that are earning high returns on equity with solid balance sheets.
Have feedback on this article? Concerned about the content? Get in touch with us directly. Alternatively, email editorial-team (at) simplywallst.com.
This article by Simply Wall St is general in nature. We provide commentary based on historical data and analyst forecasts only using an unbiased methodology and our articles are not intended to be financial advice. It does not constitute a recommendation to buy or sell any stock, and does not take account of your objectives, or your financial situation. We aim to bring you long-term focused analysis driven by fundamental data. Note that our analysis may not factor in the latest price-sensitive company announcements or qualitative material. Simply Wall St has no position in any stocks mentioned.
