Returns on Capital Paint A Bright Future For John B. Sanfilippo & Son (NASDAQ:JBSS)
What trends should we look for it we want to identify stocks that can multiply in value over the long term? One common approach is to try and find a company with returns on capital employed (ROCE) that are increasing, in conjunction with a growing amount of capital employed. If you see this, it typically means it's a company with a great business model and plenty of profitable reinvestment opportunities. So when we looked at the ROCE trend of John B. Sanfilippo & Son (NASDAQ:JBSS) we really liked what we saw.
Understanding Return On Capital Employed (ROCE)
For those who don't know, ROCE is a measure of a company's yearly pre-tax profit (its return), relative to the capital employed in the business. The formula for this calculation on John B. Sanfilippo & Son is:
Return on Capital Employed = Earnings Before Interest and Tax (EBIT) ÷ (Total Assets - Current Liabilities)
0.27 = US$90m ÷ (US$425m - US$89m) (Based on the trailing twelve months to September 2023).
So, John B. Sanfilippo & Son has an ROCE of 27%. That's a fantastic return and not only that, it outpaces the average of 11% earned by companies in a similar industry.
View our latest analysis for John B. Sanfilippo & Son
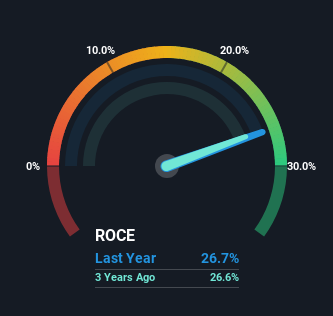
While the past is not representative of the future, it can be helpful to know how a company has performed historically, which is why we have this chart above. If you want to delve into the historical earnings, revenue and cash flow of John B. Sanfilippo & Son, check out these free graphs here.
What Does the ROCE Trend For John B. Sanfilippo & Son Tell Us?
John B. Sanfilippo & Son is displaying some positive trends. The numbers show that in the last five years, the returns generated on capital employed have grown considerably to 27%. The company is effectively making more money per dollar of capital used, and it's worth noting that the amount of capital has increased too, by 22%. So we're very much inspired by what we're seeing at John B. Sanfilippo & Son thanks to its ability to profitably reinvest capital.
In another part of our analysis, we noticed that the company's ratio of current liabilities to total assets decreased to 21%, which broadly means the business is relying less on its suppliers or short-term creditors to fund its operations. So shareholders would be pleased that the growth in returns has mostly come from underlying business performance.
The Bottom Line
All in all, it's terrific to see that John B. Sanfilippo & Son is reaping the rewards from prior investments and is growing its capital base. And a remarkable 122% total return over the last five years tells us that investors are expecting more good things to come in the future. Therefore, we think it would be worth your time to check if these trends are going to continue.
If you want to continue researching John B. Sanfilippo & Son, you might be interested to know about the 1 warning sign that our analysis has discovered.
High returns are a key ingredient to strong performance, so check out our free list ofstocks earning high returns on equity with solid balance sheets.
Have feedback on this article? Concerned about the content? Get in touch with us directly. Alternatively, email editorial-team (at) simplywallst.com.
This article by Simply Wall St is general in nature. We provide commentary based on historical data and analyst forecasts only using an unbiased methodology and our articles are not intended to be financial advice. It does not constitute a recommendation to buy or sell any stock, and does not take account of your objectives, or your financial situation. We aim to bring you long-term focused analysis driven by fundamental data. Note that our analysis may not factor in the latest price-sensitive company announcements or qualitative material. Simply Wall St has no position in any stocks mentioned.
