Returns On Capital At Stoneridge (NYSE:SRI) Paint A Concerning Picture
When researching a stock for investment, what can tell us that the company is in decline? Typically, we'll see the trend of both return on capital employed (ROCE) declining and this usually coincides with a decreasing amount of capital employed. This indicates to us that the business is not only shrinking the size of its net assets, but its returns are falling as well. So after we looked into Stoneridge (NYSE:SRI), the trends above didn't look too great.
What Is Return On Capital Employed (ROCE)?
Just to clarify if you're unsure, ROCE is a metric for evaluating how much pre-tax income (in percentage terms) a company earns on the capital invested in its business. To calculate this metric for Stoneridge, this is the formula:
Return on Capital Employed = Earnings Before Interest and Tax (EBIT) ÷ (Total Assets - Current Liabilities)
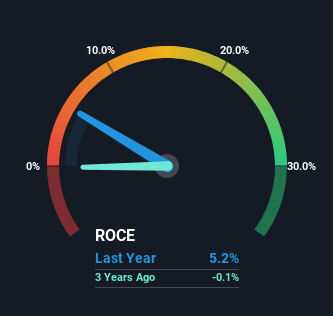
0.052 = US$16m ÷ (US$685m - US$384m) (Based on the trailing twelve months to June 2023).
Therefore, Stoneridge has an ROCE of 5.2%. In absolute terms, that's a low return and it also under-performs the Auto Components industry average of 12%.
See our latest analysis for Stoneridge
In the above chart we have measured Stoneridge's prior ROCE against its prior performance, but the future is arguably more important. If you're interested, you can view the analysts predictions in our free report on analyst forecasts for the company.
What The Trend Of ROCE Can Tell Us
We are a bit anxious about the trends of ROCE at Stoneridge. Unfortunately, returns have declined substantially over the last five years to the 5.2% we see today. On top of that, the business is utilizing 27% less capital within its operations. The fact that both are shrinking is an indication that the business is going through some tough times. Typically businesses that exhibit these characteristics aren't the ones that tend to multiply over the long term, because statistically speaking, they've already gone through the growth phase of their life cycle.
On a side note, Stoneridge's current liabilities have increased over the last five years to 56% of total assets, effectively distorting the ROCE to some degree. If current liabilities hadn't increased as much as they did, the ROCE could actually be even lower. And with current liabilities at these levels, suppliers or short-term creditors are effectively funding a large part of the business, which can introduce some risks.
The Bottom Line On Stoneridge's ROCE
In short, lower returns and decreasing amounts capital employed in the business doesn't fill us with confidence. Long term shareholders who've owned the stock over the last five years have experienced a 27% depreciation in their investment, so it appears the market might not like these trends either. Unless there is a shift to a more positive trajectory in these metrics, we would look elsewhere.
One more thing to note, we've identified 2 warning signs with Stoneridge and understanding them should be part of your investment process.
While Stoneridge isn't earning the highest return, check out this free list of companies that are earning high returns on equity with solid balance sheets.
Have feedback on this article? Concerned about the content? Get in touch with us directly. Alternatively, email editorial-team (at) simplywallst.com.
This article by Simply Wall St is general in nature. We provide commentary based on historical data and analyst forecasts only using an unbiased methodology and our articles are not intended to be financial advice. It does not constitute a recommendation to buy or sell any stock, and does not take account of your objectives, or your financial situation. We aim to bring you long-term focused analysis driven by fundamental data. Note that our analysis may not factor in the latest price-sensitive company announcements or qualitative material. Simply Wall St has no position in any stocks mentioned.
